OPEN-SOURCE SCRIPT
已更新 Gann Square Of 9 Levels
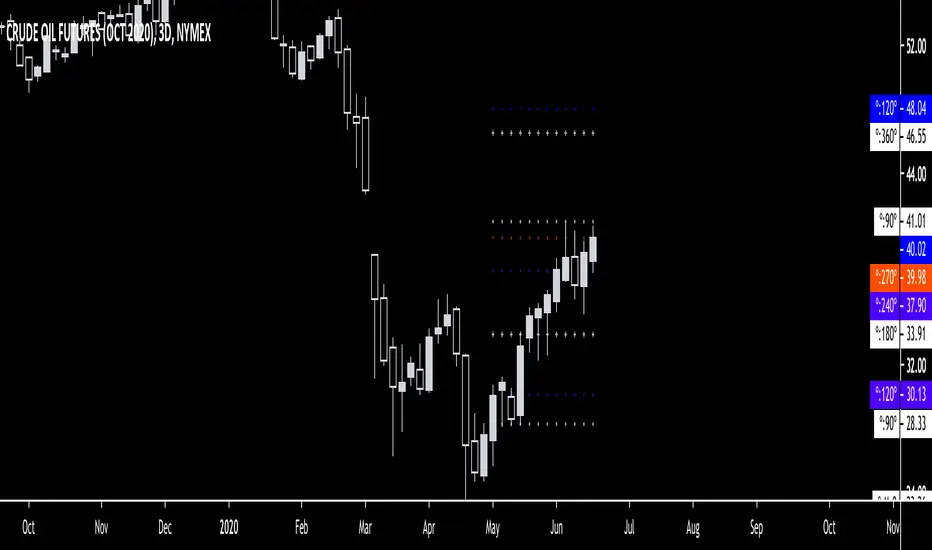
This script uses the last hlc3 value of 1H, 4H, D and/or W and rotates it 360º up/down with four increments of 90º to find out potential support and resistance areas. Can be used as a dynamic support & resistance tool or just to gauge how overbought/oversold the market is. Special thanks to @Nv56 for his assistance in writing this script.
版本注释
The first version had some minor issues with showing the most recent hlc3 value. This update fixes that problem. 版本注释
The final version. Only daily and weekly hlc3 levels.版本注释
This update includes the possibility to choose input source from the dropdown list. It is an important shift as it allows to plot the levels from lows and highs. The earlier version just had the HLC3 source hard coded in the script. Furthermore, I also added the possibility to move the decimal to the left beyond "1". This is handy when trying to plot levels for higher timeframes, especially when working with instruments that are trading in 4-5 digits like BTC, DOW etc. When plotting levels from lows or highs, the irrelevant levels should be manually unticked. This will give levels higher from a low, levels lower from a high and levels spreading out from a pivot like OHLC4, HLC3, HL2. The example in the chart shows levels higher from the previous month's low, the multiplier is set to 1 for one set of levels, and to 0.1 for another set of levels. The further you move the decimal to the left, the bigger the spread will be between levels. I hope its helps. Best of luck!开源脚本
秉承TradingView的精神,该脚本的作者将其开源,以便交易者可以查看和验证其功能。向作者致敬!您可以免费使用该脚本,但请记住,重新发布代码须遵守我们的网站规则。
免责声明
这些信息和出版物并非旨在提供,也不构成TradingView提供或认可的任何形式的财务、投资、交易或其他类型的建议或推荐。请阅读使用条款了解更多信息。
开源脚本
秉承TradingView的精神,该脚本的作者将其开源,以便交易者可以查看和验证其功能。向作者致敬!您可以免费使用该脚本,但请记住,重新发布代码须遵守我们的网站规则。
免责声明
这些信息和出版物并非旨在提供,也不构成TradingView提供或认可的任何形式的财务、投资、交易或其他类型的建议或推荐。请阅读使用条款了解更多信息。