OPEN-SOURCE SCRIPT
Steinkopff Steigung
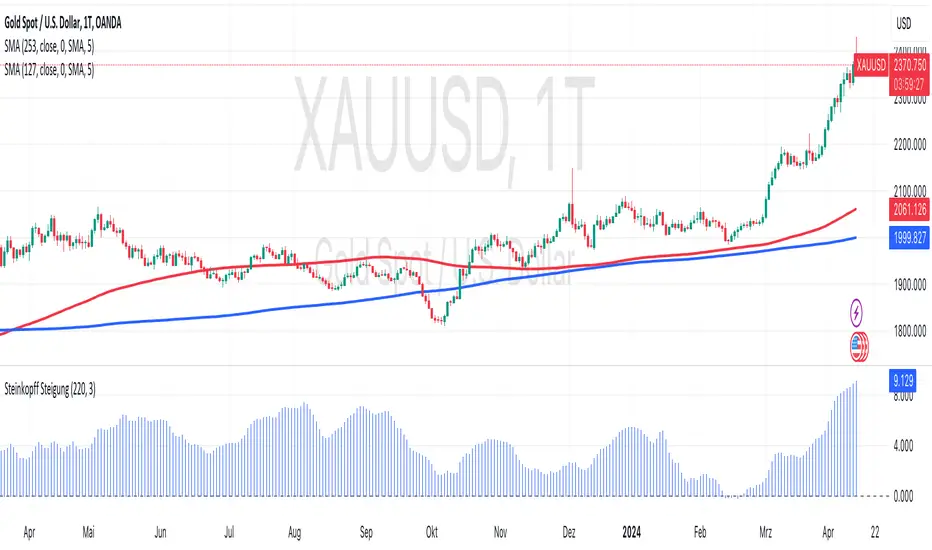
The "Steinkopff Slope" indicator is a custom tool for TradingView designed to measure and visually represent the percentage slope of a moving average. This indicator is particularly useful for analyzing the momentum of a financial instrument by highlighting changes in the slope of the moving average.
Initially, the indicator allows the user to define the length of the moving average to be used as the basis for the calculation. This input is set to 220 periods by default but can be adjusted according to the user's preference. The moving average itself is calculated based on the closing prices.
The core functionality of the indicator is to calculate the percentage slope of the moving average. This is achieved by determining the change in the moving average between the current period and the previous period and expressing this change relative to the value of the previous period. The result is then scaled by a factor of 10,000 to derive a percentage slope.
To refine the results and smooth out potential outliers, the indicator additionally performs a smoothing of the calculated slope. The user can adjust the length of this smoothing through another input parameter, which is set to 3 periods by default. The smoothed slope is finally displayed as a histogram in blue, with the line thickness set to 1.
A horizontal line at zero (displayed in gray) serves as a reference point to visually distinguish between positive and negative slopes. This helps traders and analysts identify trends: a slope above the zero line indicates a positive trend, while a slope below the zero line signals a negative trend.
In summary, the "Steinkopff Slope" indicator provides a simple yet effective way to understand the momentum and direction of a trend by analyzing and visualizing changes in the slope of a moving average over a definable period.
开源脚本
秉承TradingView的精神,该脚本的作者将其开源,以便交易者可以查看和验证其功能。向作者致敬!您可以免费使用该脚本,但请记住,重新发布代码须遵守我们的网站规则。
免责声明
这些信息和出版物并非旨在提供,也不构成TradingView提供或认可的任何形式的财务、投资、交易或其他类型的建议或推荐。请阅读使用条款了解更多信息。
开源脚本
秉承TradingView的精神,该脚本的作者将其开源,以便交易者可以查看和验证其功能。向作者致敬!您可以免费使用该脚本,但请记住,重新发布代码须遵守我们的网站规则。
免责声明
这些信息和出版物并非旨在提供,也不构成TradingView提供或认可的任何形式的财务、投资、交易或其他类型的建议或推荐。请阅读使用条款了解更多信息。