OPEN-SOURCE SCRIPT
TCC Mean Reversion
TCC Mean Reversion Indicator.
This is the mean reversion indicator. Mean reversions
are my favourite trades. You need to know how to trade
it, and find the best entries.
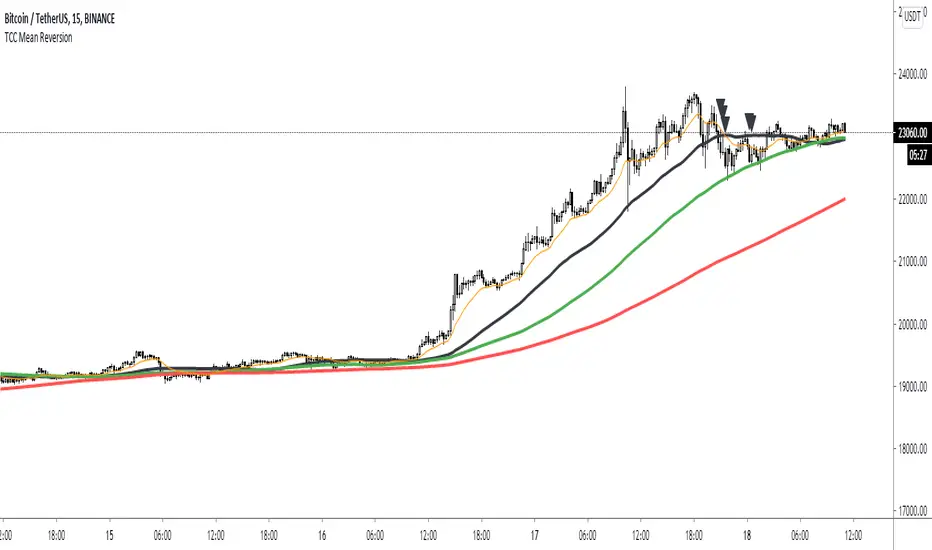
The mean reversion signals are plotted by this chart as triangles.
- black triangle: mean reversion to the SMA50
- green triangle: mean reversion to the SMA100
- red triangle: mean reversion to the SMA200
- black line: SMA50
- green line: SMA100
- red line: SMA200
You can change the timeframe (resolution) for the plotted moving averages and signals.
This allows you to quickly find mean reversion opportunities across all timeframes.
This is a very powerful tool, if used correctly.
Feel free to add them to your trading toolkit.
Regards,
Carl Everest.
This is the mean reversion indicator. Mean reversions
are my favourite trades. You need to know how to trade
it, and find the best entries.
The mean reversion signals are plotted by this chart as triangles.
- black triangle: mean reversion to the SMA50
- green triangle: mean reversion to the SMA100
- red triangle: mean reversion to the SMA200
- black line: SMA50
- green line: SMA100
- red line: SMA200
You can change the timeframe (resolution) for the plotted moving averages and signals.
This allows you to quickly find mean reversion opportunities across all timeframes.
This is a very powerful tool, if used correctly.
Feel free to add them to your trading toolkit.
Regards,
Carl Everest.
开源脚本
秉承TradingView的精神,该脚本的作者将其开源,以便交易者可以查看和验证其功能。向作者致敬!您可以免费使用该脚本,但请记住,重新发布代码须遵守我们的网站规则。
免责声明
这些信息和出版物并非旨在提供,也不构成TradingView提供或认可的任何形式的财务、投资、交易或其他类型的建议或推荐。请阅读使用条款了解更多信息。
开源脚本
秉承TradingView的精神,该脚本的作者将其开源,以便交易者可以查看和验证其功能。向作者致敬!您可以免费使用该脚本,但请记住,重新发布代码须遵守我们的网站规则。
免责声明
这些信息和出版物并非旨在提供,也不构成TradingView提供或认可的任何形式的财务、投资、交易或其他类型的建议或推荐。请阅读使用条款了解更多信息。