OPEN-SOURCE SCRIPT
已更新 Market Monitor
Overview
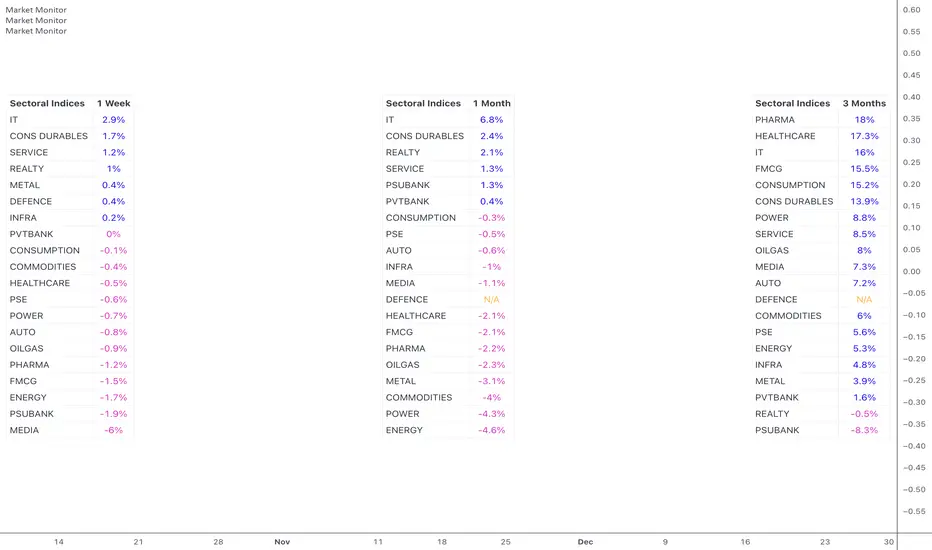
The Market Monitor Indicator provides a customisable view of dynamic percentage changes across selected indices or sectors, calculated by comparing current and previous closing prices over the chosen timeframe.
Key Features

Customisation
Use Cases
The Market Monitor Indicator provides a customisable view of dynamic percentage changes across selected indices or sectors, calculated by comparing current and previous closing prices over the chosen timeframe.
Key Features
- Choose up to 20 predefined indices or your own selected indices/stocks.
- Use checkboxes to show or hide individual entries.
- Monitor returns over daily, weekly, monthly, quarterly, half-yearly, or yearly timeframes
- Sort by returns (descending) to quickly identify top-performing indices or alphabetically for an organised and systematic review.
Customisation
- Switch between Light Mode (Blue or Green themes) and Dark Mode for visual clarity.
- Adjust the table’s size, position, and location.
- Customise the table title to your own choice e.g. Sectoral, Broad, Portfolio etc.
Use Cases
- Use multiple instances of the script with varying timeframes to study sectoral rotation and trends.
- Customise the stocks to see your portfolio returns for the day or over the past week, or longer.
版本注释
- Option to give custom titles to chosen indices. Can be used when a spread of stocks is used to create a custom index.
- Ascending sorting also added.
- Alphabetical sorting disabled for custom titles.
版本注释
- The script can now be shifted horizontally using a custom offfset value. This allows us more than 3 iterations of the table on one chart using multiple script instances.
- Alphabetical sorting is now possible in custom names too.
开源脚本
秉承TradingView的精神,该脚本的作者将其开源,以便交易者可以查看和验证其功能。向作者致敬!您可以免费使用该脚本,但请记住,重新发布代码须遵守我们的网站规则。
免责声明
这些信息和出版物并非旨在提供,也不构成TradingView提供或认可的任何形式的财务、投资、交易或其他类型的建议或推荐。请阅读使用条款了解更多信息。
开源脚本
秉承TradingView的精神,该脚本的作者将其开源,以便交易者可以查看和验证其功能。向作者致敬!您可以免费使用该脚本,但请记住,重新发布代码须遵守我们的网站规则。
免责声明
这些信息和出版物并非旨在提供,也不构成TradingView提供或认可的任何形式的财务、投资、交易或其他类型的建议或推荐。请阅读使用条款了解更多信息。