OPEN-SOURCE SCRIPT
1% Range Bars with Sequence Table
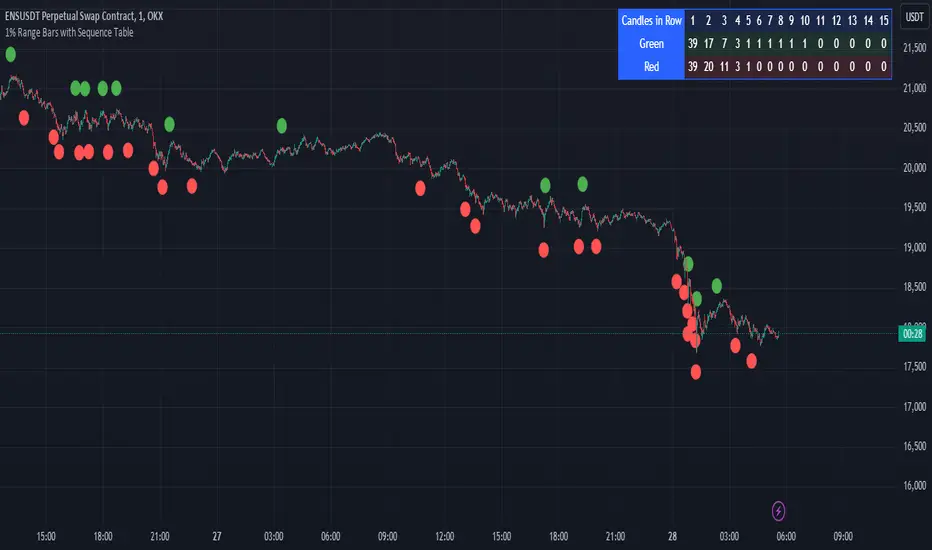
Overall Logic:
The script is designed to help traders visualize and analyze price movements on the chart, where each 1% movement is highlighted with a corresponding symbol. Additionally, the table helps track and analyze the number and length of consecutive price movements in one direction, which can be useful for identifying trends and understanding market dynamics.
This script can be particularly useful for traders looking for recurring patterns in price movements and wanting to quickly identify significant changes on the chart.
Main elements of the script:
Price Percentage Change:
The script tracks the price movement by 1% from the last significant value (the value at which the last 1% change was recorded).
If the price rises by 1% or more, a green circle is displayed above the bar.
If the price drops by 1% or more, a red circle is displayed below the bar.
Sequence Counting:
The script counts the number of consecutive 1% moves upwards (green circles) and downwards (red circles).
Separate counters are maintained for upward and downward movements, increasing each time the respective movement occurs.
If an opposite movement interrupts the sequence, the counter for the opposite direction is reset.
Sequence Table:
A table displayed on the chart shows the number of sequences of 1% movements in one direction for lengths from 1 to 15 bars.
The table is updated in real-time and shows how many times sequences of a certain length occurred on the chart, where the price moved by 1% in one direction.
开源脚本
秉承TradingView的精神,该脚本的作者将其开源,以便交易者可以查看和验证其功能。向作者致敬!您可以免费使用该脚本,但请记住,重新发布代码须遵守我们的网站规则。
免责声明
这些信息和出版物并非旨在提供,也不构成TradingView提供或认可的任何形式的财务、投资、交易或其他类型的建议或推荐。请阅读使用条款了解更多信息。
开源脚本
秉承TradingView的精神,该脚本的作者将其开源,以便交易者可以查看和验证其功能。向作者致敬!您可以免费使用该脚本,但请记住,重新发布代码须遵守我们的网站规则。
免责声明
这些信息和出版物并非旨在提供,也不构成TradingView提供或认可的任何形式的财务、投资、交易或其他类型的建议或推荐。请阅读使用条款了解更多信息。