INVITE-ONLY SCRIPT
已更新 Momentum Oscillator
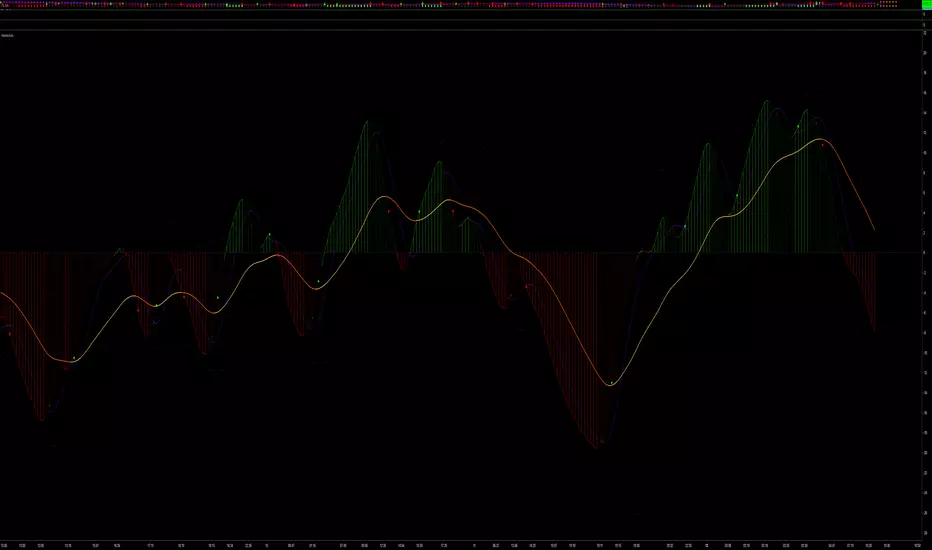
This is a heavily modified MACD to show the momentum of the market. There is a bollinger band with the source being set to MACD line to show the volatility of the momentum. The concept and settings came from Barry Burn's foundation course but I discovered that adding a bollinger band to macd line can show the squeeze and expansion of the momentum and that can be very helpful in conjunction with the whole system. If you switch to weekly chart and above, the settings automatically switches to those that Barry uses for none 1 to 3 ratio so you won't need to worry about it.
版本注释
Added the ability to switch between standard MACD formula with what Bill Williams suggests in his speeches and books. Switching to Williams formula (set to true by default) reduces the noise in the indicator and most of the time the average line (DAD) turns the color few bars earlier compared to what was before on the other hand, sometimes the crossing of the momentum line with the average line happens sooner in standard formula and sometimes later, because this one is not a consistent appearance, you can't say what formula works better in that regard.版本注释
Another slight change in the formula, switched from using close as input value to hlc3, slightly less noisy and even better calculations in regard to price changes.版本注释
changed the way momentum line is drawn, previously, it was easy to miss if the momentum is bellow zero line or not, now, it will draw as histogram easily identifying if the momentum is bellow zero or above it, also, for being able to easily see the momentum line, it will be redrawn as the line itself on top of histogram.there is added options to draw the histogram or not, same for drawing the line or not indivitually
版本注释
added an option to switch the input used for mom formula, the default is using (high + low + close) / 3 in other words using hlc3 but bill williams uses another formula (high + low) / volume, if you check mark the input option for bill williams, you get totally different results shown in the copy bellow the original, witch ever you want to use, you have the option now.版本注释
Added an option to switch the average calculation bar numbers from what Barry Burn suggests to what Bill Williams suggest.Thiis oscillator is almost finished with every chance and system you can put on it.
The top instance is what you would get by default, HLC3 as input and the number settings based on Barry's suggestions but uses SMA instead of EMA in macd calculations.
The second one is still using SMA and HLC3, but instead of Barry's suggested numbers for bar calculations, it's using Williams suggested numbers. As you see, the cross between MOM and DAD is happening much faster in time but there are instances of them going back and forth in crossing when the top one is not doing it.
The third instance is using Barry's suggested numbers, with SMA but uses MFI from Williams book.
The last instance is what you would get if you completely go with Bill Williams, the suggested bar calcultions, with MFI as input and SMA in calculations.
版本注释
Changed the default state of the momentum oscillator to mimic barry burn's formulaAdded a 7 SMA for MOM
Added color signals for when MOM moves above / bellow 7 SMA and DAD
Moved plots around for better order on what draws on top of what
版本注释
- Changed the histogram color to mimic what we have in my methodology and Uni Renko toolset- Removed the cloud drawing between momentum and DAD, would make the chart look too busy
- Changed the way signals are being drawn from background bars to crosses on the oscillator itself
仅限邀请脚本
只有作者授权的用户才能访问此脚本。您需要申请并获得使用许可。通常情况下,付款后即可获得许可。更多详情,请按照下方作者的说明操作,或直接联系CAB_Member。
TradingView不建议您付费购买或使用任何脚本,除非您完全信任其作者并了解其工作原理。您也可以在我们的社区脚本找到免费的开源替代方案。
作者的说明
免责声明
这些信息和出版物并非旨在提供,也不构成TradingView提供或认可的任何形式的财务、投资、交易或其他类型的建议或推荐。请阅读使用条款了解更多信息。
仅限邀请脚本
只有作者授权的用户才能访问此脚本。您需要申请并获得使用许可。通常情况下,付款后即可获得许可。更多详情,请按照下方作者的说明操作,或直接联系CAB_Member。
TradingView不建议您付费购买或使用任何脚本,除非您完全信任其作者并了解其工作原理。您也可以在我们的社区脚本找到免费的开源替代方案。
作者的说明
免责声明
这些信息和出版物并非旨在提供,也不构成TradingView提供或认可的任何形式的财务、投资、交易或其他类型的建议或推荐。请阅读使用条款了解更多信息。