PROTECTED SOURCE SCRIPT
已更新 RelicusRoad - Signal Line

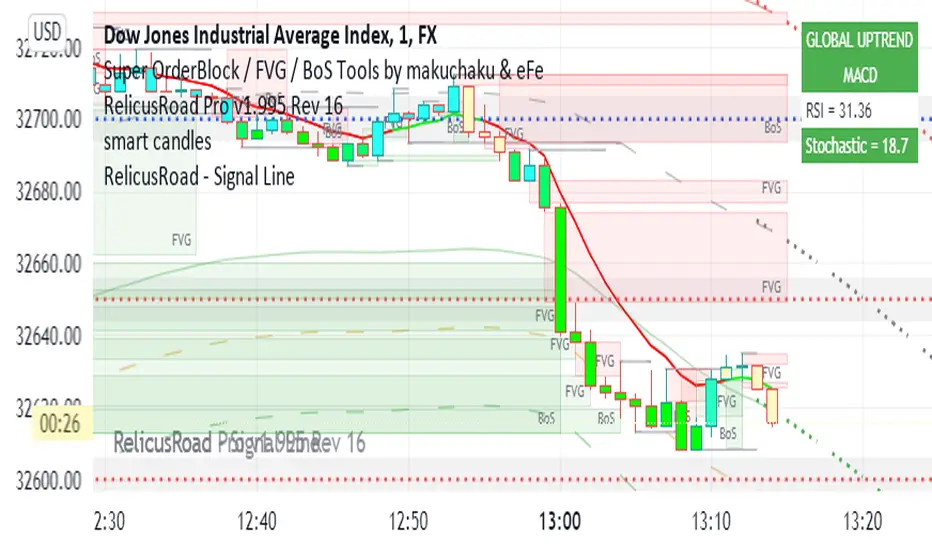
When you have charts full of too many indicators, it can mess up with your analysis and cause analysis paralysis. Use RelicusRoad Signal Line to simply your charts with a beautiful color changing moving average line as per the strategies selected.
4 different strategies to choose from:
1) MACD
2) PMACD (Price Action + MACD)
3) Parabolic SAR
4) Momentum
GREEN: BUY ZONE
RED: SELL ZONE
FUNCTIONS OVERVIEW
MACD: Moving average convergence divergence ( MACD ) is a trend-following momentum indicator that shows the relationship between two moving averages of a security’s price. The MACD is calculated by subtracting the 26-period exponential moving average ( EMA ) from the 12-period EMA .
The result of that calculation is the MACD line. A 9 EMA of the MACD called the "signal line," is then plotted on top of the MACD line, which can function as a trigger for buy and sell signals. Traders may buy the security when the MACD crosses above its signal line and sell—or short—the security when the MACD crosses below the signal line. Moving average convergence divergence ( MACD ) indicators can be interpreted in several ways, but the more common methods are crossovers, divergences, and rapid rises/falls.
PMACD: It's an improvement to MACD that you can use the Red/Green indications to make better decisions.
Parabolic SAR: The parabolic SAR indicator, developed by J. Wells Wilder, is used by traders to determine trend direction and potential reversals in price. The indicator uses a trailing stop and reverse method called "SAR," or stop and reverse, to identify suitable exit and entry points. Traders also refer to the indicator as the parabolic stop and reverse , parabolic SAR , or PSAR.
Momentum: On paper, momentum investing seems less like an investing strategy and more like a knee-jerk reaction to market information. The idea of selling losers and buying winners is seductive, but it flies in the face of the tried and true Wall Street adage, "buy low, sell high."
4 different strategies to choose from:
1) MACD
2) PMACD (Price Action + MACD)
3) Parabolic SAR
4) Momentum
GREEN: BUY ZONE
RED: SELL ZONE
FUNCTIONS OVERVIEW
MACD: Moving average convergence divergence ( MACD ) is a trend-following momentum indicator that shows the relationship between two moving averages of a security’s price. The MACD is calculated by subtracting the 26-period exponential moving average ( EMA ) from the 12-period EMA .
The result of that calculation is the MACD line. A 9 EMA of the MACD called the "signal line," is then plotted on top of the MACD line, which can function as a trigger for buy and sell signals. Traders may buy the security when the MACD crosses above its signal line and sell—or short—the security when the MACD crosses below the signal line. Moving average convergence divergence ( MACD ) indicators can be interpreted in several ways, but the more common methods are crossovers, divergences, and rapid rises/falls.
- Moving average convergence divergence ( MACD ) is calculated by subtracting the 26-period exponential moving average ( EMA ) from the 12-period EMA .
- MACD triggers technical signals when it crosses above (to buy) or below (to sell) its signal line.
- The speed of crossovers is also taken as a signal of a market is overbought or oversold.
- MACD helps investors understand whether the bullish or bearish movement in the price is strengthening or weakening.
PMACD: It's an improvement to MACD that you can use the Red/Green indications to make better decisions.
Parabolic SAR: The parabolic SAR indicator, developed by J. Wells Wilder, is used by traders to determine trend direction and potential reversals in price. The indicator uses a trailing stop and reverse method called "SAR," or stop and reverse, to identify suitable exit and entry points. Traders also refer to the indicator as the parabolic stop and reverse , parabolic SAR , or PSAR.
- The parabolic SAR indicator appears on a chart as a series of dots, either above or below an asset's price, depending on the direction the price is moving. A dot is placed below the price when it is trending upward, and above the price when it is trending downward.
- The parabolic SAR (stop and reverse) indicator is used by technical traders to spot trends and reversals.
- The indicator utilizes a system of dots superimposed onto a price chart.
A reversal occurs when these dots flip, but a reversal signal in the SAR does not necessarily mean a reversal in the price. A PSAR reversal only means that the price and indicator have crossed.
Momentum: On paper, momentum investing seems less like an investing strategy and more like a knee-jerk reaction to market information. The idea of selling losers and buying winners is seductive, but it flies in the face of the tried and true Wall Street adage, "buy low, sell high."
- Momentum investing is a trading strategy in which investors buy securities that are rising and sell them when they look to have peaked.
- The goal is to work with volatility by finding buying opportunities in short-term uptrends and then sell when the securities start to lose momentum.
Then, the investor takes the cash and looks for the next short-term uptrend, or buying opportunity, and repeats the process. - Skilled traders understand when to enter into a position, how long to hold it for, and when to exit; they can also react to short-term, news-driven spikes or selloffs.
- Risks of momentum trading include moving into a position too early, closing out too late, and getting distracted and missing key trends and technical deviations.
版本注释
Added color change capabilities.版本注释
Removed Website Watermark.版本注释
Updated Web Link版本注释
Removed Link.受保护脚本
此脚本以闭源形式发布。 但是,您可以自由使用,没有任何限制 — 了解更多信息这里。
Visit: relicusroad.com
Join: discord.gg/WApEq9Kr
Join: discord.gg/WApEq9Kr
免责声明
这些信息和出版物并非旨在提供,也不构成TradingView提供或认可的任何形式的财务、投资、交易或其他类型的建议或推荐。请阅读使用条款了解更多信息。
受保护脚本
此脚本以闭源形式发布。 但是,您可以自由使用,没有任何限制 — 了解更多信息这里。
Visit: relicusroad.com
Join: discord.gg/WApEq9Kr
Join: discord.gg/WApEq9Kr
免责声明
这些信息和出版物并非旨在提供,也不构成TradingView提供或认可的任何形式的财务、投资、交易或其他类型的建议或推荐。请阅读使用条款了解更多信息。