INVITE-ONLY SCRIPT
(15) Trade Risk Reduction VS-132
TRR calculates the volatility of your stock. This is just the magnitude of each days price fluctuations, or what technicians refer to as the True Range. TRR averages the True Range (ATR) over three different time periods.
Why three? You want a sensitive indicator that reflect both the long term historical volatility of the equity as well as what that volatility is right now. Obviously the most recent trading days are the most important. The three ATR periods and their weighting factors are:
1) We use a 251 day period which equates to 1 trading year because we want to know what the historical volatility is. This one year period is not weighted.
2) We utilize a 21 day period because the most recent weeks tells us what the stock volatility has been over the previous calendar month. This is weighted by a factor of 2.
3) Finally, we utilize the last weeks data, Last 5 days, (L5D) to provide us with the stocks movement in the most recent trading days. This is weighted by a factor of 4.
The total of ATR251*(1) + ATR21*(2) + ATR5*(4) is then divided by the total of all factors (7).
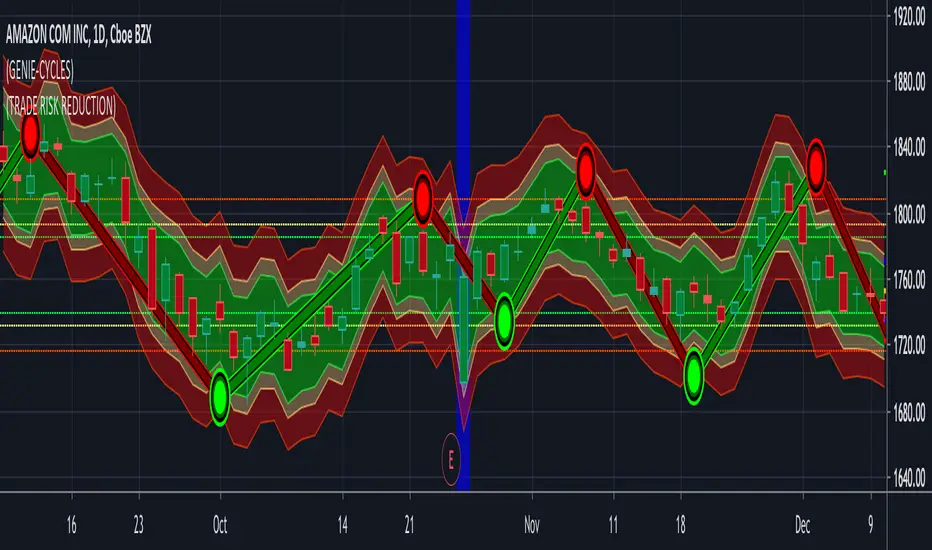
This results in the Weighted Average True Range that the Trade Risk Reduction utilizes to produce the dynamic bands on your charts as well as power the Risk and Stop loss calculators. These indicate where this indicator is currently recommending you place stops. In the Format options of the application you are provided with the ability to adjust these band. Keep in mind that each stock will act in it's own unique and characteristic way. Looking closely at the stock's historical data, both in longer and shorter time periods should provide you with some insight into the normal variations and fluctuations of this particular equity. Below EBAY provides an example of this.
Access this Genie indicator for your Tradingview account, through our web site. (Links Below) This will provide you with additional educational information and reference articles, videos, input and setting options and trading strategies this indicator excels in.
Why three? You want a sensitive indicator that reflect both the long term historical volatility of the equity as well as what that volatility is right now. Obviously the most recent trading days are the most important. The three ATR periods and their weighting factors are:
1) We use a 251 day period which equates to 1 trading year because we want to know what the historical volatility is. This one year period is not weighted.
2) We utilize a 21 day period because the most recent weeks tells us what the stock volatility has been over the previous calendar month. This is weighted by a factor of 2.
3) Finally, we utilize the last weeks data, Last 5 days, (L5D) to provide us with the stocks movement in the most recent trading days. This is weighted by a factor of 4.
The total of ATR251*(1) + ATR21*(2) + ATR5*(4) is then divided by the total of all factors (7).
This results in the Weighted Average True Range that the Trade Risk Reduction utilizes to produce the dynamic bands on your charts as well as power the Risk and Stop loss calculators. These indicate where this indicator is currently recommending you place stops. In the Format options of the application you are provided with the ability to adjust these band. Keep in mind that each stock will act in it's own unique and characteristic way. Looking closely at the stock's historical data, both in longer and shorter time periods should provide you with some insight into the normal variations and fluctuations of this particular equity. Below EBAY provides an example of this.
Access this Genie indicator for your Tradingview account, through our web site. (Links Below) This will provide you with additional educational information and reference articles, videos, input and setting options and trading strategies this indicator excels in.
仅限邀请脚本
只有作者授权的用户才能访问此脚本。您需要申请并获得使用许可。通常情况下,付款后即可获得许可。更多详情,请按照下方作者的说明操作,或直接联系StockSwinger。
TradingView不建议您付费购买或使用任何脚本,除非您完全信任其作者并了解其工作原理。您也可以在我们的社区脚本找到免费的开源替代方案。
作者的说明
免责声明
这些信息和出版物并非旨在提供,也不构成TradingView提供或认可的任何形式的财务、投资、交易或其他类型的建议或推荐。请阅读使用条款了解更多信息。
仅限邀请脚本
只有作者授权的用户才能访问此脚本。您需要申请并获得使用许可。通常情况下,付款后即可获得许可。更多详情,请按照下方作者的说明操作,或直接联系StockSwinger。
TradingView不建议您付费购买或使用任何脚本,除非您完全信任其作者并了解其工作原理。您也可以在我们的社区脚本找到免费的开源替代方案。
作者的说明
免责声明
这些信息和出版物并非旨在提供,也不构成TradingView提供或认可的任何形式的财务、投资、交易或其他类型的建议或推荐。请阅读使用条款了解更多信息。