OPEN-SOURCE SCRIPT
Geometric Mean Indicator
This script calculates and plots the Geometric Mean (GM) of two significant price levels (in this case, moving averages) to identify balance points or equilibrium levels in the market.
Key Components of the Script:
Input Variables:
length1: Defines the period for the first moving average (representing the first radius 𝑥x).
length2: Defines the period for the second moving average (representing the second radius
𝑦y).
Moving Averages (Price Levels):
ma1: The first moving average (calculated using the closing price over the period defined by length1).
ma2: The second moving average (calculated using the closing price over the period defined by length2).
Geometric Mean (GM) Calculation:
The geometric mean between the two moving averages is calculated as:
GM = sqrt(ma1 * ma2)
This value represents the midpoint or balance between the two price levels (analogous to the geometric mean between the radii in the mathematical discovery).
Plotting the Values:
The script plots:
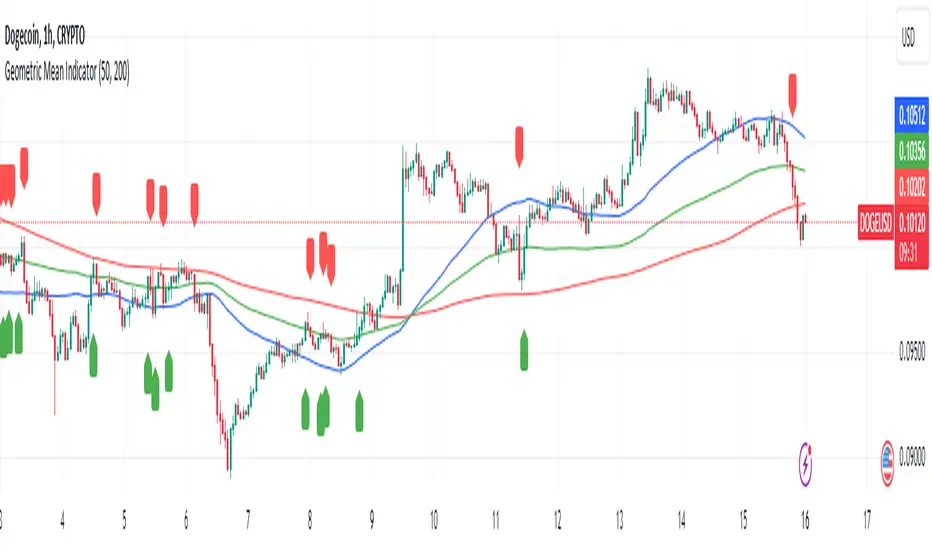
ma1: First moving average (blue line).
ma2: Second moving average (red line).
geometric_mean: The geometric mean of the two moving averages (green line), which serves as the dynamic equilibrium point.
Visual Markers for Crossovers:
The script detects when the price crosses above or below the geometric mean:
Green markers (below the bar) indicate a crossover above the geometric mean.
Red markers (above the bar) indicate a crossover below the geometric mean.
Purpose of the Indicator:
The Geometric Mean Indicator is designed to:
Highlight equilibrium points: The geometric mean between two price levels can signal areas where the market is balanced or poised for a potential breakout.
Detect potential trend reversals: When the price crosses above or below the geometric mean, it can indicate shifts in market momentum, similar to how the GM in geometry represents a transition point.
How to Use:
Dynamic Equilibrium: The geometric mean (green line) represents a balance between two price levels (moving averages) and can act as support or resistance.
Price Crossovers: Watch for price crossing the geometric mean to identify potential trend changes or areas of significant price action.
Adjust Inputs: You can modify the lengths of the moving averages (length1 and length2) to adjust the sensitivity of the indicator based on different timeframes or strategies.
Summary in Context of the Geometric Proof:
The script applies the geometric concept of the Geometric Mean (GM) as a balance point between two radii (represented by moving averages in this case).
It mirrors the idea that the GM is the midpoint of the tangent slope between two circles, where the moving averages (or price levels) serve as the "radii" in the market context.
Key Components of the Script:
Input Variables:
length1: Defines the period for the first moving average (representing the first radius 𝑥x).
length2: Defines the period for the second moving average (representing the second radius
𝑦y).
Moving Averages (Price Levels):
ma1: The first moving average (calculated using the closing price over the period defined by length1).
ma2: The second moving average (calculated using the closing price over the period defined by length2).
Geometric Mean (GM) Calculation:
The geometric mean between the two moving averages is calculated as:
GM = sqrt(ma1 * ma2)
This value represents the midpoint or balance between the two price levels (analogous to the geometric mean between the radii in the mathematical discovery).
Plotting the Values:
The script plots:
ma1: First moving average (blue line).
ma2: Second moving average (red line).
geometric_mean: The geometric mean of the two moving averages (green line), which serves as the dynamic equilibrium point.
Visual Markers for Crossovers:
The script detects when the price crosses above or below the geometric mean:
Green markers (below the bar) indicate a crossover above the geometric mean.
Red markers (above the bar) indicate a crossover below the geometric mean.
Purpose of the Indicator:
The Geometric Mean Indicator is designed to:
Highlight equilibrium points: The geometric mean between two price levels can signal areas where the market is balanced or poised for a potential breakout.
Detect potential trend reversals: When the price crosses above or below the geometric mean, it can indicate shifts in market momentum, similar to how the GM in geometry represents a transition point.
How to Use:
Dynamic Equilibrium: The geometric mean (green line) represents a balance between two price levels (moving averages) and can act as support or resistance.
Price Crossovers: Watch for price crossing the geometric mean to identify potential trend changes or areas of significant price action.
Adjust Inputs: You can modify the lengths of the moving averages (length1 and length2) to adjust the sensitivity of the indicator based on different timeframes or strategies.
Summary in Context of the Geometric Proof:
The script applies the geometric concept of the Geometric Mean (GM) as a balance point between two radii (represented by moving averages in this case).
It mirrors the idea that the GM is the midpoint of the tangent slope between two circles, where the moving averages (or price levels) serve as the "radii" in the market context.
开源脚本
秉承TradingView的精神,该脚本的作者将其开源,以便交易者可以查看和验证其功能。向作者致敬!您可以免费使用该脚本,但请记住,重新发布代码须遵守我们的网站规则。
免责声明
这些信息和出版物并非旨在提供,也不构成TradingView提供或认可的任何形式的财务、投资、交易或其他类型的建议或推荐。请阅读使用条款了解更多信息。
开源脚本
秉承TradingView的精神,该脚本的作者将其开源,以便交易者可以查看和验证其功能。向作者致敬!您可以免费使用该脚本,但请记住,重新发布代码须遵守我们的网站规则。
免责声明
这些信息和出版物并非旨在提供,也不构成TradingView提供或认可的任何形式的财务、投资、交易或其他类型的建议或推荐。请阅读使用条款了解更多信息。