PROTECTED SOURCE SCRIPT
已更新 MACD BB v2.00 Indicator CryptoPotato748
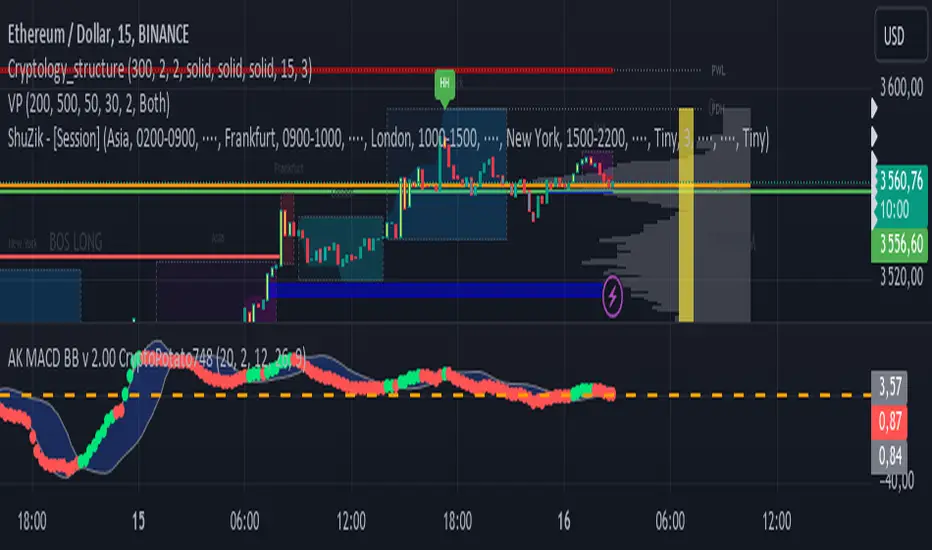
The MACD BB v2.00 CryptoPotato748 is a custom technical analysis indicator for TradingView that combines the Moving Average Convergence Divergence (MACD) with Bollinger Bands to provide a powerful tool for identifying trend strength and potential trading signals. This indicator is designed to automatically adapt its parameters based on the selected time frame, making it versatile and suitable for various trading strategies and time horizons.
Features
MACD Calculation:
The MACD line is calculated using the difference between the 12-period and 26-period Exponential Moving Averages (EMAs).
The Signal line is the 9-period EMA of the MACD line.
These parameters automatically adjust based on the selected time frame to optimize performance.
Bollinger Bands:
Bollinger Bands are calculated based on the MACD line to identify overbought and oversold conditions.
The bands consist of a 20-period Simple Moving Average (SMA) of the MACD line, with upper and lower bands set 2 standard deviations away.
These parameters also adjust based on the selected time frame for better alignment with market conditions.
Adaptive Time Frames:
The indicator automatically adjusts its MACD and Bollinger Bands parameters based on the selected chart time frame, including 1 minute, 3 minutes, 5 minutes, 15 minutes, 30 minutes, 1 hour, 2 hours, 4 hours, 12 hours, 1 day, 3 days, 1 week, and 1 month.
This ensures the indicator remains effective across various time frames without manual reconfiguration.
Visual Elements:
The upper and lower Bollinger Bands are plotted in gray, with a blue fill between them for easy visualization.
The MACD line is plotted with circle markers, colored lime when above the upper band and red when below the lower band.
A zero line is plotted in orange for reference.
Bar colors change to yellow when the MACD line is above the upper band (indicating a potential buy signal) and aqua when below the lower band (indicating a potential sell signal).
How to Use
Adding to Chart:
Copy and paste the script into the Pine Editor on TradingView.
Click "Add to Chart" to see the indicator in action.
Interpreting Signals:
MACD Above Upper Band (Lime): Indicates strong bullish momentum, potential buy signal.
MACD Below Lower Band (Red): Indicates strong bearish momentum, potential sell signal.
Yellow Bars: Suggest a potential buy condition.
Aqua Bars: Suggest a potential sell condition.
Adaptive Parameters:
The indicator automatically adjusts its parameters based on the selected time frame, ensuring optimal performance across different trading environments.
版本注释
update受保护脚本
此脚本以闭源形式发布。 但是,您可以自由使用,没有任何限制 — 了解更多信息这里。
免责声明
这些信息和出版物并非旨在提供,也不构成TradingView提供或认可的任何形式的财务、投资、交易或其他类型的建议或推荐。请阅读使用条款了解更多信息。
受保护脚本
此脚本以闭源形式发布。 但是,您可以自由使用,没有任何限制 — 了解更多信息这里。
免责声明
这些信息和出版物并非旨在提供,也不构成TradingView提供或认可的任何形式的财务、投资、交易或其他类型的建议或推荐。请阅读使用条款了解更多信息。