OPEN-SOURCE SCRIPT
Mark Earnings Day
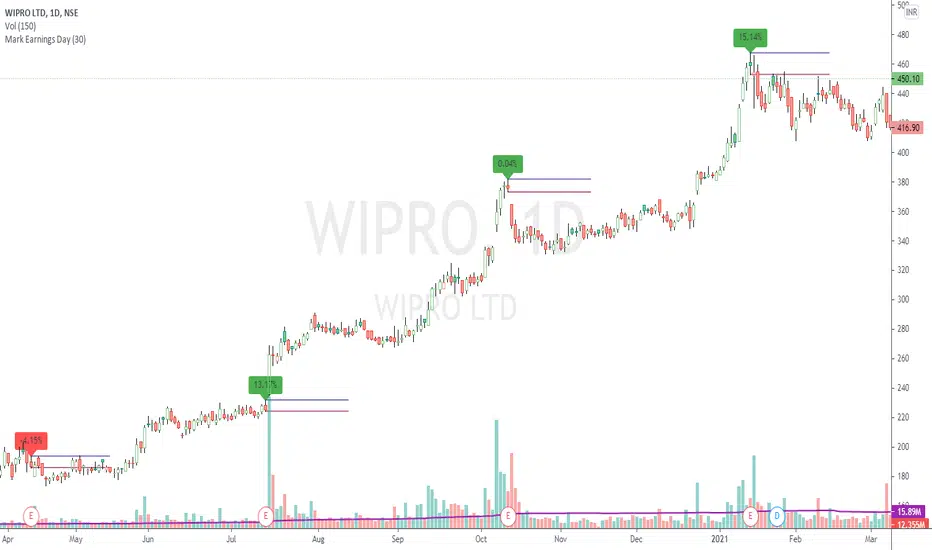
The idea for today is to plot high / low prices on the Earnings day. (use only on Daily timeframe)
And as we all know, most of the times, price is unidirectional after the earnings are declared.
A target of 1:2 or even 1:5 can be easily achieved in these cases, within few days.
Green label indicates, reported earnings are higher than estimated. Red indicates the other way.
But 1, this does not necessarily indicate the trend direction.
But 2, a breakout / breakdown of this day's candle mostly does. The other serving as a Stop Loss.
Optionally, the scripts can also plot splits and dividends on the charts.
The difference between this indicator and readily available default markings on the chart is,
these figures are directly available on the chart itself, that saves multiple clicks.
开源脚本
秉承TradingView的精神,该脚本的作者将其开源,以便交易者可以查看和验证其功能。向作者致敬!您可以免费使用该脚本,但请记住,重新发布代码须遵守我们的网站规则。
免责声明
这些信息和出版物并非旨在提供,也不构成TradingView提供或认可的任何形式的财务、投资、交易或其他类型的建议或推荐。请阅读使用条款了解更多信息。
开源脚本
秉承TradingView的精神,该脚本的作者将其开源,以便交易者可以查看和验证其功能。向作者致敬!您可以免费使用该脚本,但请记住,重新发布代码须遵守我们的网站规则。
免责声明
这些信息和出版物并非旨在提供,也不构成TradingView提供或认可的任何形式的财务、投资、交易或其他类型的建议或推荐。请阅读使用条款了解更多信息。