OPEN-SOURCE SCRIPT
已更新 Call and Put by Powerful Trading
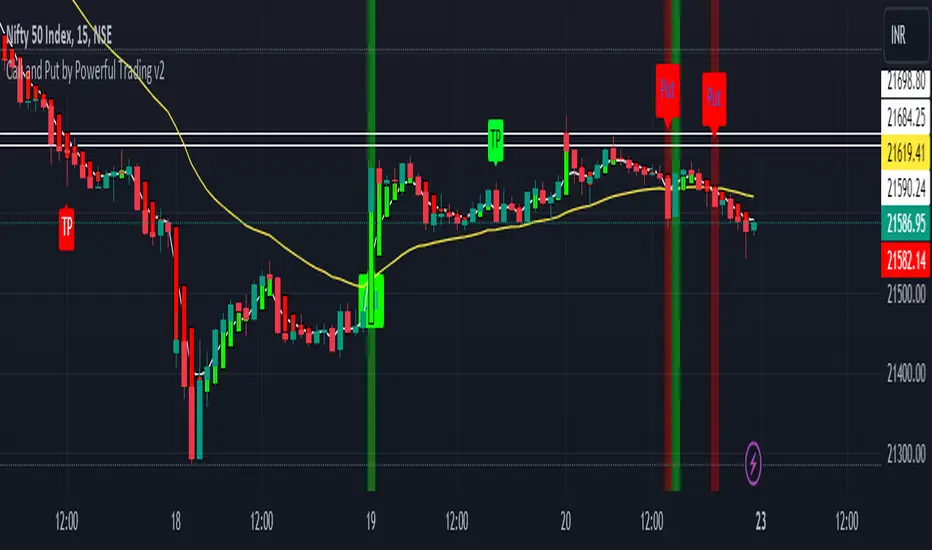
This script attempts to use Exponential Moving averages (short-term and long-term convergence) of different lengths in order to identify trade entries and exits for bullish & bearish trades. I would strongly recommend using it on Bank nifty , Nifty 50 .https://www.tradingview.com/x/P71QZJEd/ You use this script by entering a trade when it signals a green CALL signal with a UP label and exiting when it signals red put signal. The general idea is that one is fast and one is slow-moving EMA and these indicate when to buy/sell when they crossover the overbought/sold lines.
It also provides a vertical line with green and red color , when short ema is over it shows green vertical line and when short ema is below it provides red vertical line.
Best for bank nifty on 15 mins chart
It also provides a vertical line with green and red color , when short ema is over it shows green vertical line and when short ema is below it provides red vertical line.
Best for bank nifty on 15 mins chart
版本注释
If you don't understand when to exit we have added crosses on chart.Plus now you can identify the trends with the help of Heikin ashi candle shown with the normal chart.
Also wrong signals given have been fixed.
Now it seems best to trade on any charts and anytime frame
Suggested time frame 2 hours char and 15 mins chart
Works best with banknifty , forex and btcusd now.
版本注释
New update -Alerts added
Best settings already given for 15 mins
Now settings can be taken till 1
Take profit added with SMI calculations.
To use this updated chart , remove and re add the indicator.
开源脚本
秉承TradingView的精神,该脚本的作者将其开源,以便交易者可以查看和验证其功能。向作者致敬!您可以免费使用该脚本,但请记住,重新发布代码须遵守我们的网站规则。
免责声明
这些信息和出版物并非旨在提供,也不构成TradingView提供或认可的任何形式的财务、投资、交易或其他类型的建议或推荐。请阅读使用条款了解更多信息。
开源脚本
秉承TradingView的精神,该脚本的作者将其开源,以便交易者可以查看和验证其功能。向作者致敬!您可以免费使用该脚本,但请记住,重新发布代码须遵守我们的网站规则。
免责声明
这些信息和出版物并非旨在提供,也不构成TradingView提供或认可的任何形式的财务、投资、交易或其他类型的建议或推荐。请阅读使用条款了解更多信息。