OPEN-SOURCE SCRIPT
已更新 Bullseye NYSE 1st5m
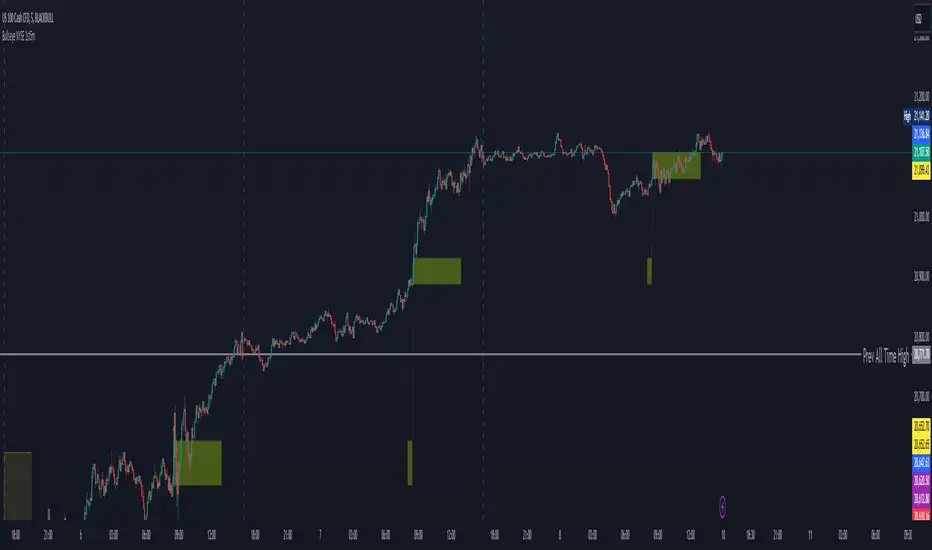
This script, "BullseyeNYSE1st5m," is a TradingView indicator designed to highlight the high and low price levels during the first 5 minutes of the NYSE trading session. It works as follows:
1. **Identify NYSE Trading Hours**: The script identifies bars that fall within NYSE trading hours, specifically focusing on the first five minutes after the market opens.
2. **Calculate First 5-Minute High and Low**: During the first five minutes of the trading day, the script captures and updates the high and low prices, storing these values for the remainder of the session.
3. **Plot High and Low Levels**: The high and low values from the first five minutes are plotted as lines on the chart in yellow. This helps traders quickly identify the initial range set by the market.
4. **Fill the Area Between High and Low**: The area between the high and low levels is filled with a translucent yellow color to visually emphasize the first five-minute range.
5. **Alerts for Breakouts**: Alerts are set to notify the user when the price closes above or below the first five-minute range. This helps traders stay informed of potential breakout opportunities beyond this key opening range.
This indicator is useful for day traders looking to leverage the first few minutes of NYSE trading to identify early support and resistance levels and to spot breakout opportunities.
版本注释
UPDATE: The Background is only visible. keep the chart clean.版本注释
Functional on higher timeframes版本注释
This updated "Bullseye NYSE 1st5m" script is designed to highlight the first five-minute trading range of the NYSE session. It includes an adjustable start time for NYSE trading hours, allowing the user to modify the hour as needed. The script calculates the high and low for the first five minutes of trading, plots these levels, and fills the area between them for easy visualization. Additionally, alerts are provided for breakouts above or below the five-minute range. The script also includes an optional daylight savings time adjustment for accurate tracking.开源脚本
秉承TradingView的精神,该脚本的作者将其开源,以便交易者可以查看和验证其功能。向作者致敬!您可以免费使用该脚本,但请记住,重新发布代码须遵守我们的网站规则。
免责声明
这些信息和出版物并非旨在提供,也不构成TradingView提供或认可的任何形式的财务、投资、交易或其他类型的建议或推荐。请阅读使用条款了解更多信息。
开源脚本
秉承TradingView的精神,该脚本的作者将其开源,以便交易者可以查看和验证其功能。向作者致敬!您可以免费使用该脚本,但请记住,重新发布代码须遵守我们的网站规则。
免责声明
这些信息和出版物并非旨在提供,也不构成TradingView提供或认可的任何形式的财务、投资、交易或其他类型的建议或推荐。请阅读使用条款了解更多信息。