INVITE-ONLY SCRIPT
Mayfair Advanced Regressions 1.0
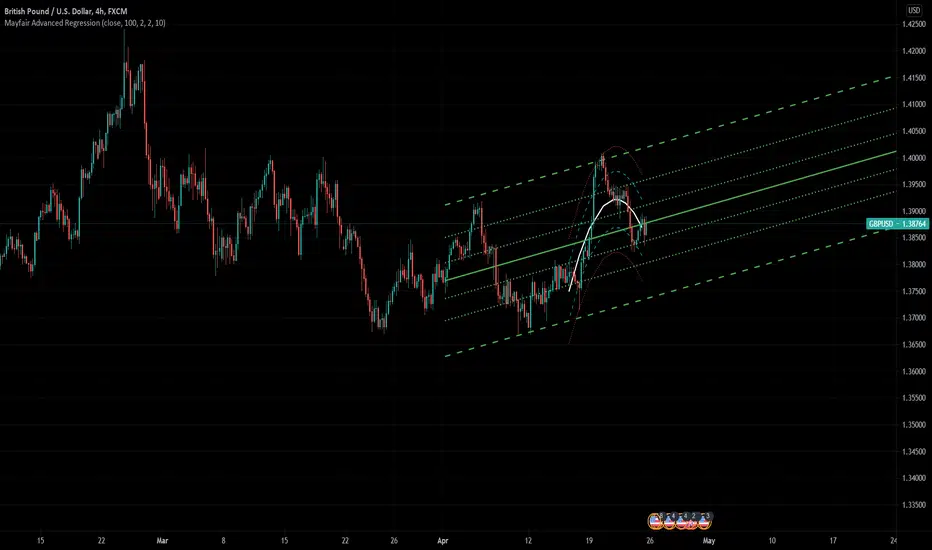
This indicator maps two regressions.
The outer regression (green straight lines in the chart) tracks the main trend. It save you from working out your own trend channels, BUT it does move with the price, so it is different from a static channel. You can use it as a template for drawing static channels though.
The inner regression (the curved lines) is a parabolic regression. It shows the shorter term trend within the outer trend. This helps traders to judge when it is right or wrong to take a position on the edge of the main regression, based on whether the inner regression is indicating an acceleration out of the channel, or is shaping to go with the main trend.
We find it works best if there is a clear trend. If the market is not trending, then there isn't much point using a trend analysis tool like this.
Like all indicators, it is not perfect, and you should never rely on one indicator in any situation.
仅限邀请脚本
只有作者授权的用户才能访问此脚本。您需要申请并获得使用许可。通常情况下,付款后即可获得许可。更多详情,请按照下方作者的说明操作,或直接联系Paul_Varcoe。
TradingView不建议您付费购买或使用任何脚本,除非您完全信任其作者并了解其工作原理。您也可以在我们的社区脚本找到免费的开源替代方案。
作者的说明
To buy this script, please go here: https://launchpass.com/mayfair-trading-and-mentoring/regressions
eBook ON SURVIVAL: amazon.co.uk/dp/B0BSY763W3
THE CITY TRADERS: thecitytraders.com/?aff=9
Discord: discord.gg/Ma7SnExcWA
THE CITY TRADERS: thecitytraders.com/?aff=9
Discord: discord.gg/Ma7SnExcWA
免责声明
这些信息和出版物并非旨在提供,也不构成TradingView提供或认可的任何形式的财务、投资、交易或其他类型的建议或推荐。请阅读使用条款了解更多信息。