OPEN-SOURCE SCRIPT
Expected Move Plotter [CHE]
Expected Move Plotter [CHE]
"There is magic in everything new."
Introduction:
This script is an indicator for financial trading that plots the expected movement of a security based on the average range over the last five periods. The script is written in Pine Script, a high-level programming language used for creating technical indicators, strategies, and other trading tools for the TradingView platform.
Inputs:
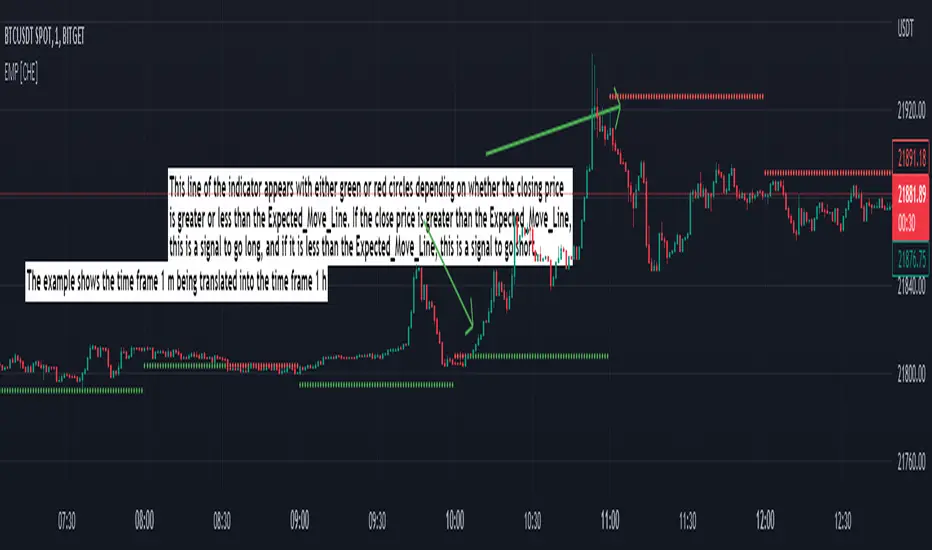
Percentage of Open and Close: This input specifies the percentage of the open and close price to use for the expected movement.
Time Periods: The script takes the different time periods into account and translates them to either 60 seconds, 240 seconds, 1 day, 3 days, 7 days, 1 month, 3 months or 12 months.
Calculation:
The script uses the "Open" and "High"/"Low" values of the last 5 periods to calculate the average range and plots the expected movement above and below the current open price. The plot is either green or red depending on whether the expected move is above or below the current close.
Code Breakdown:
The script starts by defining three integer constants: MS_IN_MIN, MS_IN_HOUR, and MS_IN_DAY, which represent the number of milliseconds in a minute, hour, and day, respectively.
The function timeStep_translate() returns a string that represents the timeframe for a chart based on the current timeframe. The function first converts the chart's timeframe to milliseconds and then uses a switch statement to determine the string value to be returned based on the number of milliseconds in the timeframe.
The script then retrieves the data for the open, high, and low values for the last five periods. The high and low values are used to calculate the average range, which is then used to plot the expected movement above and below the current open price.
Conclusion:
This script provides traders with a visual representation of the expected movement of a security based on the average range over the last five periods. It takes different time periods into account and provides a clear indication of whether the expected move is above or below the current close. The script is easy to use and provides a useful tool for traders looking to make informed trading decisions.
Best regards Chervolino
"There is magic in everything new."
Introduction:
This script is an indicator for financial trading that plots the expected movement of a security based on the average range over the last five periods. The script is written in Pine Script, a high-level programming language used for creating technical indicators, strategies, and other trading tools for the TradingView platform.
Inputs:
Percentage of Open and Close: This input specifies the percentage of the open and close price to use for the expected movement.
Time Periods: The script takes the different time periods into account and translates them to either 60 seconds, 240 seconds, 1 day, 3 days, 7 days, 1 month, 3 months or 12 months.
Calculation:
The script uses the "Open" and "High"/"Low" values of the last 5 periods to calculate the average range and plots the expected movement above and below the current open price. The plot is either green or red depending on whether the expected move is above or below the current close.
Code Breakdown:
The script starts by defining three integer constants: MS_IN_MIN, MS_IN_HOUR, and MS_IN_DAY, which represent the number of milliseconds in a minute, hour, and day, respectively.
The function timeStep_translate() returns a string that represents the timeframe for a chart based on the current timeframe. The function first converts the chart's timeframe to milliseconds and then uses a switch statement to determine the string value to be returned based on the number of milliseconds in the timeframe.
The script then retrieves the data for the open, high, and low values for the last five periods. The high and low values are used to calculate the average range, which is then used to plot the expected movement above and below the current open price.
Conclusion:
This script provides traders with a visual representation of the expected movement of a security based on the average range over the last five periods. It takes different time periods into account and provides a clear indication of whether the expected move is above or below the current close. The script is easy to use and provides a useful tool for traders looking to make informed trading decisions.
Best regards Chervolino
开源脚本
秉承TradingView的精神,该脚本的作者将其开源,以便交易者可以查看和验证其功能。向作者致敬!您可以免费使用该脚本,但请记住,重新发布代码须遵守我们的网站规则。
免责声明
这些信息和出版物并非旨在提供,也不构成TradingView提供或认可的任何形式的财务、投资、交易或其他类型的建议或推荐。请阅读使用条款了解更多信息。
开源脚本
秉承TradingView的精神,该脚本的作者将其开源,以便交易者可以查看和验证其功能。向作者致敬!您可以免费使用该脚本,但请记住,重新发布代码须遵守我们的网站规则。
免责声明
这些信息和出版物并非旨在提供,也不构成TradingView提供或认可的任何形式的财务、投资、交易或其他类型的建议或推荐。请阅读使用条款了解更多信息。