OPEN-SOURCE SCRIPT
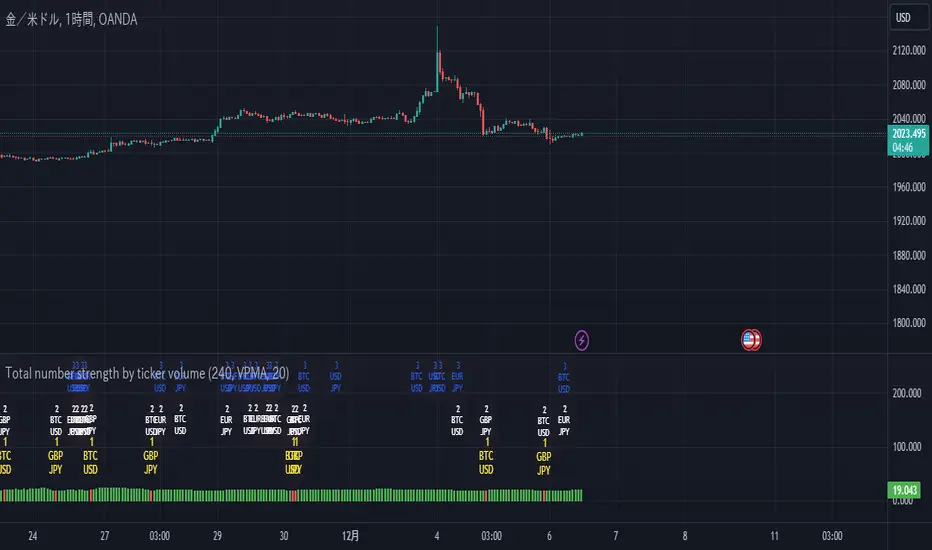
Total number strength by ticker volume
This is about stocks, which I always analyze.
Figure this out by looking at what the code calls ta.secutity.
This indicator plots the highest value of the ratio of total volume to individual volume for the stock you are analyzing, and the histogram tumbles to red when the stock changes in that value. The changed value is plotted as a label above that histogram. By using this indicator, you can determine which is currently the focus of attention, and if there are outliers, you will know by the histogram's detachment.
The parameters are explained below, but Timefream is the market value to be determined
setvalue sets the item to be judged, and lenght sets the time period to be judged. setvalue is the parameter that determines the timeframe for the judgment. vol is the volume, VP is the total purchase price, VPMA is its average, VPMAD is the detachment from its average, MA is the average of the vol, MAD is the detachment from its average, LRC is the average of the vol, and LRC is the average of the vol. value of linear regression, and also
The calculation of detachment is not negative because it comes out as a square, but it is not a problem because it is calculated as a percentage.
There is a *problem, and if the timefreame to be displayed is not calculated below the value of timefreame, an error will occur. We are currently searching for a solution to this problem. If you know the solution, I would appreciate it if you could let me know in the chat.
开源脚本
秉承TradingView的精神,该脚本的作者将其开源,以便交易者可以查看和验证其功能。向作者致敬!您可以免费使用该脚本,但请记住,重新发布代码须遵守我们的网站规则。
免责声明
这些信息和出版物并非旨在提供,也不构成TradingView提供或认可的任何形式的财务、投资、交易或其他类型的建议或推荐。请阅读使用条款了解更多信息。
免责声明
这些信息和出版物并非旨在提供,也不构成TradingView提供或认可的任何形式的财务、投资、交易或其他类型的建议或推荐。请阅读使用条款了解更多信息。