OPEN-SOURCE SCRIPT
已更新 Stochastic Trend mtf
Definition
The Stochastic RSI indicator (Stoch RSI) is actually an indicator of an indicator. It is used in technical analysis to provide a stochastic calculation to the RSI indicator. This means it's an RSI measure relative to its own high/low range over a user-defined time period. Stochastic RSI is an oscillator that calculates a value between 0 and 1 and then plots it as a line. This indicator is primarily used to identify overbought and oversold conditions.
It is important to remember that the Stoch RSI is an indicator of an indicator that is two steps away from the price. The RSI is one step away from the price and therefore a stochastic calculation of the RSI is two steps away. This is important because as with any indicator that is more than one step away from price, the Stoch RSI can be short-term disconnected from actual price action. However, as a range-bound indicator, the Stoch RSI's primary function is to identify cross-bought, overbought and oversold conditions.
Use
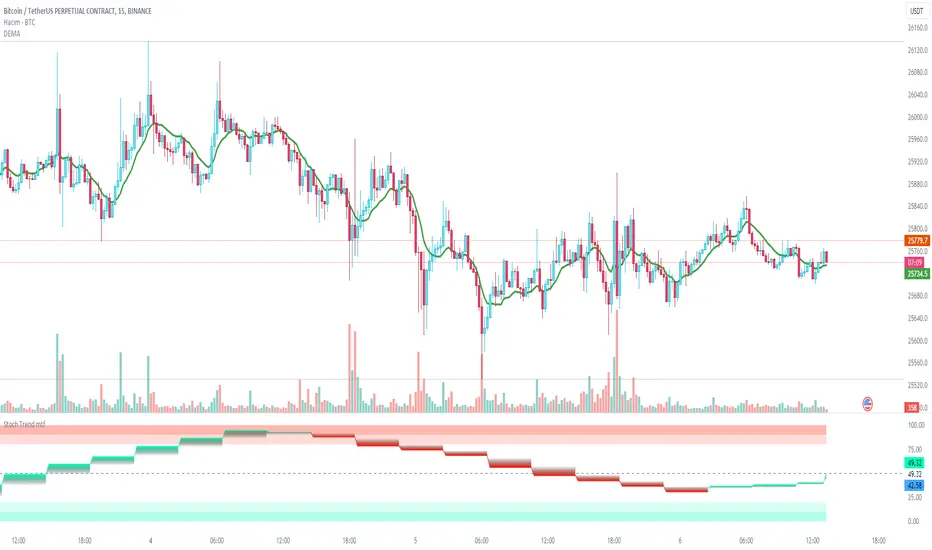
When we integrate it into our chart in the upper time frame, it both gives the direction of the trend more healthy and is more efficient in terms of noise reduction in terms of leaving the overbought-sold zones. Unlike the classic stochastic, I set the "d" value to 8. Even though the trend returns are a little late, we see healthier data on our graph. Trend changes in overbought zones are getting stronger. Coloring red indicates that the trend is selling, while painting green indicates that the trend is buying. I hope you find it useful, if you have any questions or suggestions, please feel free to ask.
Good luck...
It is not investment advice.
The Stochastic RSI indicator (Stoch RSI) is actually an indicator of an indicator. It is used in technical analysis to provide a stochastic calculation to the RSI indicator. This means it's an RSI measure relative to its own high/low range over a user-defined time period. Stochastic RSI is an oscillator that calculates a value between 0 and 1 and then plots it as a line. This indicator is primarily used to identify overbought and oversold conditions.
It is important to remember that the Stoch RSI is an indicator of an indicator that is two steps away from the price. The RSI is one step away from the price and therefore a stochastic calculation of the RSI is two steps away. This is important because as with any indicator that is more than one step away from price, the Stoch RSI can be short-term disconnected from actual price action. However, as a range-bound indicator, the Stoch RSI's primary function is to identify cross-bought, overbought and oversold conditions.
Use
When we integrate it into our chart in the upper time frame, it both gives the direction of the trend more healthy and is more efficient in terms of noise reduction in terms of leaving the overbought-sold zones. Unlike the classic stochastic, I set the "d" value to 8. Even though the trend returns are a little late, we see healthier data on our graph. Trend changes in overbought zones are getting stronger. Coloring red indicates that the trend is selling, while painting green indicates that the trend is buying. I hope you find it useful, if you have any questions or suggestions, please feel free to ask.
Good luck...
It is not investment advice.
版本注释
DefinitionThe Stochastic RSI indicator (Stoch RSI) is actually an indicator of an indicator. It is used in technical analysis to provide a stochastic calculation to the RSI indicator. This means it's an RSI measure relative to its own high/low range over a user-defined time period. Stochastic RSI is an oscillator that calculates a value between 0 and 1 and then plots it as a line. This indicator is primarily used to identify overbought and oversold conditions.
It is important to remember that the Stoch RSI is an indicator of an indicator that is two steps away from the price. The RSI is one step away from the price and therefore a stochastic calculation of the RSI is two steps away. This is important because as with any indicator that is more than one step away from price, the Stoch RSI can be short-term disconnected from actual price action. However, as a range-bound indicator, the Stoch RSI's primary function is to identify cross-bought, overbought and oversold conditions.
Use
When we integrate it into our chart in the upper time frame, it both gives the direction of the trend more healthy and is more efficient in terms of noise reduction in terms of leaving the overbought-sold zones. Unlike the classic stochastic, I set the "d" value to 8. Even though the trend returns are a little late, we see healthier data on our graph. Trend changes in overbought zones are getting stronger. Coloring red indicates that the trend is selling, while painting green indicates that the trend is buying. I hope you find it useful, if you have any questions or suggestions, please feel free to ask.
Good luck...
It is not investment advice.
Bar color feature added. 12/08/2024
开源脚本
秉承TradingView的精神,该脚本的作者将其开源,以便交易者可以查看和验证其功能。向作者致敬!您可以免费使用该脚本,但请记住,重新发布代码须遵守我们的网站规则。
免责声明
这些信息和出版物并非旨在提供,也不构成TradingView提供或认可的任何形式的财务、投资、交易或其他类型的建议或推荐。请阅读使用条款了解更多信息。
开源脚本
秉承TradingView的精神,该脚本的作者将其开源,以便交易者可以查看和验证其功能。向作者致敬!您可以免费使用该脚本,但请记住,重新发布代码须遵守我们的网站规则。
免责声明
这些信息和出版物并非旨在提供,也不构成TradingView提供或认可的任何形式的财务、投资、交易或其他类型的建议或推荐。请阅读使用条款了解更多信息。