OPEN-SOURCE SCRIPT
已更新 FV 15min MS_230906_co
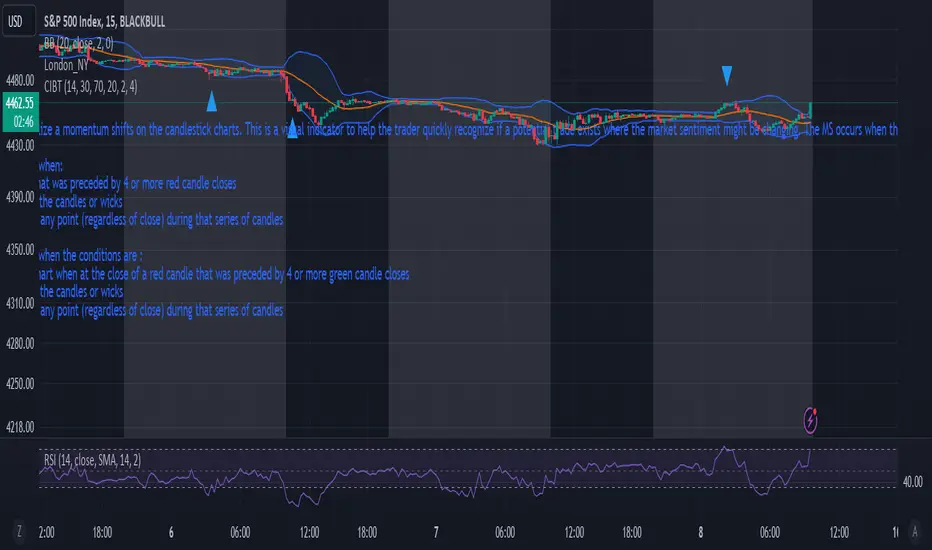
This script allows the user to visualize a momentum shifts on the candlestick charts. This is a visual indicator to help the trader quickly recognize if a potential trade exists where the market sentiment might be changing. The MS occurs when the below parameters are followed:
Creates blue triangle on the chart when:
1) at the close of a green candle that was preceded by 4 or more red candle closes
2) The RSI falls below 30 during of the candles or wicks
3) The bollinger band is pierced at any point (regardless of close) during that series of candles
Creates blue triangle on the chart when the conditions are :
1) creates a blue triangle on the chart when at the close of a red candle that was preceded by 4 or more green candle closes
2) The RSI goes above 70 during of the candles or wicks
3) The bollinger band is pierced at any point (regardless of close) during that series of candles
版本注释
This script allows the user to visualize a momentum shifts on the candlestick charts. This is a visual indicator to help the trader quickly recognize if a potential trade exists where the market sentiment might be changing. The MS occurs when the below parameters are followed:Creates blue triangle on the chart when:
1) at the close of a green candle that was preceded by 4 or more red candle closes
2) The RSI falls below 30 during of the candles or wicks
3) The bollinger band is pierced at any point (regardless of close) during that series of candles
Creates blue triangle on the chart when the conditions are :
1) creates a blue triangle on the chart when at the close of a red candle that was preceded by 4 or more green candle closes
2) The RSI goes above 70 during of the candles or wicks
3) The bollinger band is pierced at any point (regardless of close) during that series of candles
开源脚本
秉承TradingView的精神,该脚本的作者将其开源,以便交易者可以查看和验证其功能。向作者致敬!您可以免费使用该脚本,但请记住,重新发布代码须遵守我们的网站规则。
免责声明
这些信息和出版物并非旨在提供,也不构成TradingView提供或认可的任何形式的财务、投资、交易或其他类型的建议或推荐。请阅读使用条款了解更多信息。
免责声明
这些信息和出版物并非旨在提供,也不构成TradingView提供或认可的任何形式的财务、投资、交易或其他类型的建议或推荐。请阅读使用条款了解更多信息。