OPEN-SOURCE SCRIPT
Slow Volume Strength Index (SVSI)
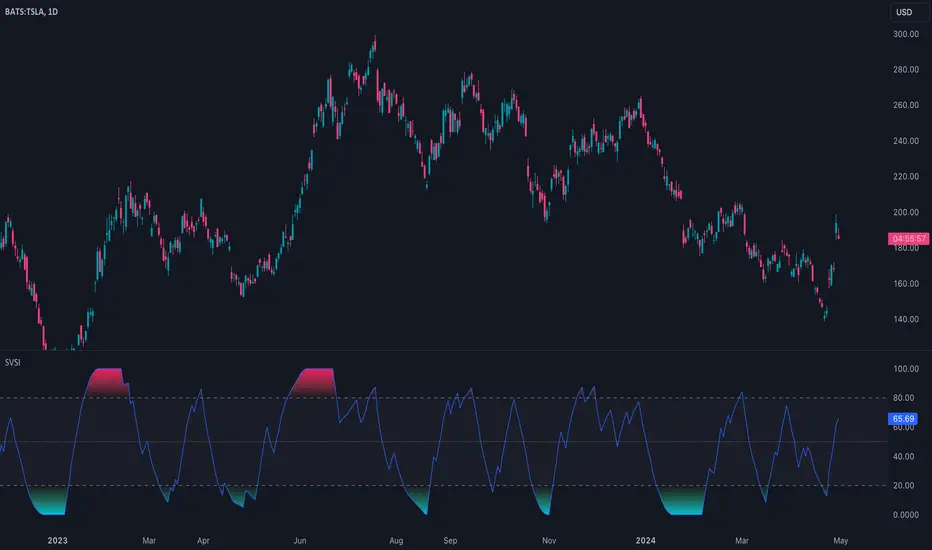
The Slow Volume Strength Index (SVSI), introduced by Vitali Apirine in Stocks & Commodities (Volume 33, Chapter 6, Page 28-31), is a momentum oscillator inspired by the Relative Strength Index (RSI). It gauges buying and selling pressure by analyzing the disparity between average volume on up days and down days, relative to the underlying price trend. Positive volume signifies closes above the exponential moving average (EMA), while negative volume indicates closes below. Flat closes register zero volume. The SVSI then applies a smoothing technique to this data and transforms it into an oscillator with values ranging from 0 to 100.
Traders can leverage the SVSI in several ways:
1. Overbought/Oversold Levels: Standard thresholds of 80 and 20 define overbought and oversold zones, respectively.
2. Centerline Crossovers and Divergences: Signals can be generated by the indicator line crossing a midline or by divergences from price movements.
3. Confirmation for Slow RSI: The SVSI can be used to confirm signals generated by the Slow Relative Strength Index (SRSI), another oscillator developed by Apirine.
🔹 Algorithm
In the original article, the SVSI is calculated using the following formula:
Pine Script®
where:
Pine Script®
* Volume is considered positive when the closing price is higher than the six-day EMA.
* Volume is considered negative when the closing price is lower than the six-day EMA.
* Negative volume values are expressed as absolute values (positive).
* If the closing price equals the six-day EMA, volume is considered zero (no change).
* When calculating the average volume, the indicator utilizes Wilder's smoothing technique, as described in his book "New Concepts In Technical Trading Systems."
Note that this indicator, the formula has been simplified to be
Pine Script®
This formula achieves the same result as the original article's proposal, but in a more concise way and without the need for special handling of division by zero
🔹 Parameters
The SVSI calculation offers configurable parameters that can be adjusted to suit individual trading styles and goals. While the default lookback periods are 6 for the EMA and 14 for volume smoothing, alternative values can be explored. Additionally, the standard overbought and oversold thresholds of 80 and 20 can be adapted to better align with the specific security being analyzed.
Traders can leverage the SVSI in several ways:
1. Overbought/Oversold Levels: Standard thresholds of 80 and 20 define overbought and oversold zones, respectively.
2. Centerline Crossovers and Divergences: Signals can be generated by the indicator line crossing a midline or by divergences from price movements.
3. Confirmation for Slow RSI: The SVSI can be used to confirm signals generated by the Slow Relative Strength Index (SRSI), another oscillator developed by Apirine.
🔹 Algorithm
In the original article, the SVSI is calculated using the following formula:
SVSI = 100 - (100 / (1 + SVS))
where:
SVS = Average Positive Volume / Average Negative Volume
* Volume is considered positive when the closing price is higher than the six-day EMA.
* Volume is considered negative when the closing price is lower than the six-day EMA.
* Negative volume values are expressed as absolute values (positive).
* If the closing price equals the six-day EMA, volume is considered zero (no change).
* When calculating the average volume, the indicator utilizes Wilder's smoothing technique, as described in his book "New Concepts In Technical Trading Systems."
Note that this indicator, the formula has been simplified to be
SVSI = 100 * Average Positive Volume / (Average Positive Volume + Average Negative Volume)
This formula achieves the same result as the original article's proposal, but in a more concise way and without the need for special handling of division by zero
🔹 Parameters
The SVSI calculation offers configurable parameters that can be adjusted to suit individual trading styles and goals. While the default lookback periods are 6 for the EMA and 14 for volume smoothing, alternative values can be explored. Additionally, the standard overbought and oversold thresholds of 80 and 20 can be adapted to better align with the specific security being analyzed.
开源脚本
秉承TradingView的精神,该脚本的作者将其开源,以便交易者可以查看和验证其功能。向作者致敬!您可以免费使用该脚本,但请记住,重新发布代码须遵守我们的网站规则。
专业缠论指标: alphaviz.pro/chanlun
Email: contact@alphaviz.pro
Discord: discord.gg/w2fFtNega4
Email: contact@alphaviz.pro
Discord: discord.gg/w2fFtNega4
免责声明
这些信息和出版物并非旨在提供,也不构成TradingView提供或认可的任何形式的财务、投资、交易或其他类型的建议或推荐。请阅读使用条款了解更多信息。