OPEN-SOURCE SCRIPT
Volume Density Analysis
Volume Density Analysis
Overview
The "Volume Density Analysis" indicator is designed to provide traders with insights into volume dynamics relative to price movements. By analyzing the density of volume against price spread, this indicator helps identify potential reversal points and extreme volume conditions, enhancing decision-making in trading strategies.
Key Features
Volume Density Calculation: The indicator computes the density of volume by dividing the total volume by the price spread (high - low) for each bar. This allows for a more nuanced understanding of volume activity in relation to price movements.
Extremum Detection: Users can specify the number of bars to consider when identifying extreme volume conditions, allowing for tailored analysis based on market behavior.
Reversal Bar Conditions: The indicator includes options to determine if low or high volume bars must coincide with reversal patterns, providing additional context for potential trade signals.
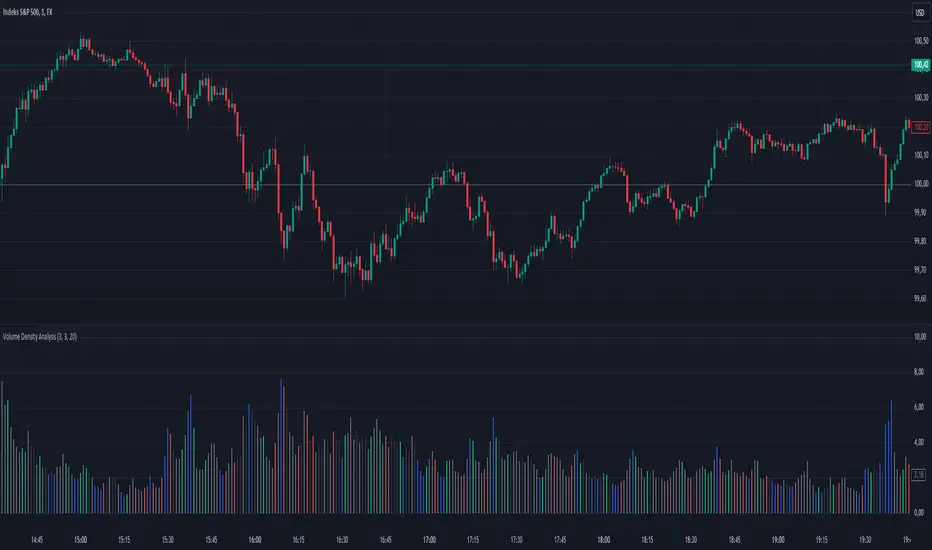
Dynamic Coloring*: The histogram displays colored bars based on specific conditions:
Blue Bars: Indicate the lowest and highest volume density within a specified range, highlighting significant volume extremes.
Gray Bars: Represent lower or higher volume density that meets reversal criteria.
Green and Red Bars: Indicate bullish or bearish reversal signals based on historical density patterns.
User Inputs
nl: Number of previous lower bars to consider for comparison (default is 8).
nh: Number of previous higher bars to consider for comparison (default is 8).
ext: Number of bars for detecting extremum volume (default is 30).
LReversalBar: Boolean option to determine if low volume bar spread must indicate a reversal.
HReversalBar: Boolean option to determine if high volume bar spread must indicate a reversal.
Suggested Timeframes
M15: Without reversal considerations, use `nl=3`, `nh=3`, and `ext=20`.
M5: Without reversal considerations, use `nl=4`, `nh=4`, and `ext=35`.
M1: Use `nl=8`, `nh=8`, and `ext=58` for more detailed analysis.
Overview
The "Volume Density Analysis" indicator is designed to provide traders with insights into volume dynamics relative to price movements. By analyzing the density of volume against price spread, this indicator helps identify potential reversal points and extreme volume conditions, enhancing decision-making in trading strategies.
Key Features
Volume Density Calculation: The indicator computes the density of volume by dividing the total volume by the price spread (high - low) for each bar. This allows for a more nuanced understanding of volume activity in relation to price movements.
Extremum Detection: Users can specify the number of bars to consider when identifying extreme volume conditions, allowing for tailored analysis based on market behavior.
Reversal Bar Conditions: The indicator includes options to determine if low or high volume bars must coincide with reversal patterns, providing additional context for potential trade signals.
Dynamic Coloring*: The histogram displays colored bars based on specific conditions:
Blue Bars: Indicate the lowest and highest volume density within a specified range, highlighting significant volume extremes.
Gray Bars: Represent lower or higher volume density that meets reversal criteria.
Green and Red Bars: Indicate bullish or bearish reversal signals based on historical density patterns.
User Inputs
nl: Number of previous lower bars to consider for comparison (default is 8).
nh: Number of previous higher bars to consider for comparison (default is 8).
ext: Number of bars for detecting extremum volume (default is 30).
LReversalBar: Boolean option to determine if low volume bar spread must indicate a reversal.
HReversalBar: Boolean option to determine if high volume bar spread must indicate a reversal.
Suggested Timeframes
M15: Without reversal considerations, use `nl=3`, `nh=3`, and `ext=20`.
M5: Without reversal considerations, use `nl=4`, `nh=4`, and `ext=35`.
M1: Use `nl=8`, `nh=8`, and `ext=58` for more detailed analysis.
开源脚本
秉承TradingView的精神,该脚本的作者将其开源,以便交易者可以查看和验证其功能。向作者致敬!您可以免费使用该脚本,但请记住,重新发布代码须遵守我们的网站规则。
免责声明
这些信息和出版物并非旨在提供,也不构成TradingView提供或认可的任何形式的财务、投资、交易或其他类型的建议或推荐。请阅读使用条款了解更多信息。
开源脚本
秉承TradingView的精神,该脚本的作者将其开源,以便交易者可以查看和验证其功能。向作者致敬!您可以免费使用该脚本,但请记住,重新发布代码须遵守我们的网站规则。
免责声明
这些信息和出版物并非旨在提供,也不构成TradingView提供或认可的任何形式的财务、投资、交易或其他类型的建议或推荐。请阅读使用条款了解更多信息。