OPEN-SOURCE SCRIPT
已更新 Hull ZigZag

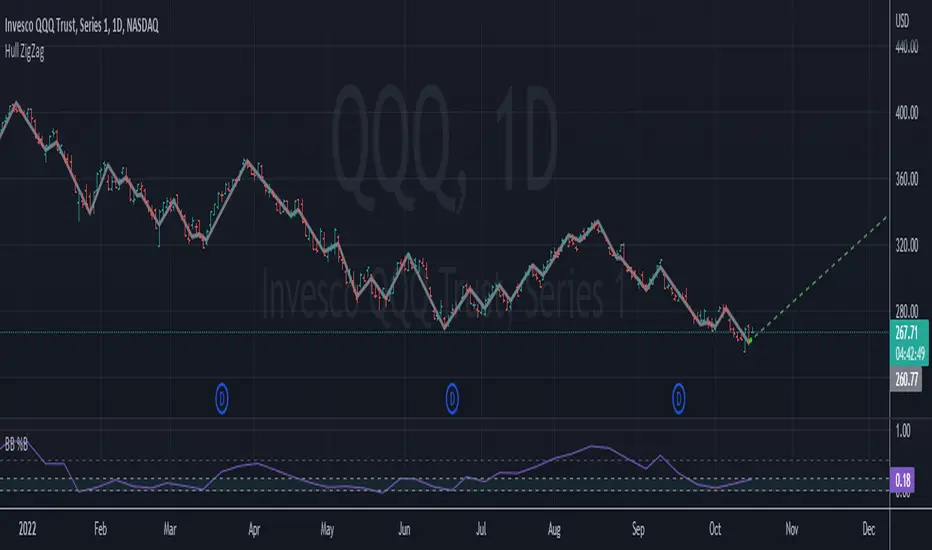
A simple indicator I use to filter out noise. it tracks reversals of a Hull Moving Average, which ultimately highlights short term trends and potential chart patterns. I've also included an option to project the most recent trend forward, if that is something you would like to tinker with.
版本注释
Added a second trendline to indicate if price trend is accelerating or decelerating. The gray line will follow the colored one, the angle between the lines is indicative of the change in momentum.- if GREEN line is above (RED below) the gray, the trend is parabolic.
- if GREEN line (or RED) is near gray, the trend is linear.
- if GREEN line is below (RED above) the gray, the trend is consolidating.
版本注释
Added max_bars_back to weed out a bug that causes intermittent errors upon loading.版本注释
just to update picture开源脚本
秉承TradingView的精神,该脚本的作者将其开源,以便交易者可以查看和验证其功能。向作者致敬!您可以免费使用该脚本,但请记住,重新发布代码须遵守我们的网站规则。
免责声明
这些信息和出版物并非旨在提供,也不构成TradingView提供或认可的任何形式的财务、投资、交易或其他类型的建议或推荐。请阅读使用条款了解更多信息。
开源脚本
秉承TradingView的精神,该脚本的作者将其开源,以便交易者可以查看和验证其功能。向作者致敬!您可以免费使用该脚本,但请记住,重新发布代码须遵守我们的网站规则。
免责声明
这些信息和出版物并非旨在提供,也不构成TradingView提供或认可的任何形式的财务、投资、交易或其他类型的建议或推荐。请阅读使用条款了解更多信息。