OPEN-SOURCE SCRIPT
TASC 2023.03 Every Little Bit Helps
█ OVERVIEW
TASC's February 2023 edition of Traders' Tips includes an article titled "Every Little Bit Helps: Averaging The Open And Close To Reduce Noise" by John Ehlers. This code implements the numerical example from this article.
█ CONCEPTS
Using theories from digital signal processing as a starting point, John Ehlers argues that using the average of the open and close as the source time series of an indicator instead of using only the closing price can often lead to noise reduction in the output. This effect especially applies when there is no gap between the current bar's opening and the previous bar's closing prices. This trick can reduce noise in many common indicators such as the RSI, MACD, and Stochastic.
█ CALCULATIONS
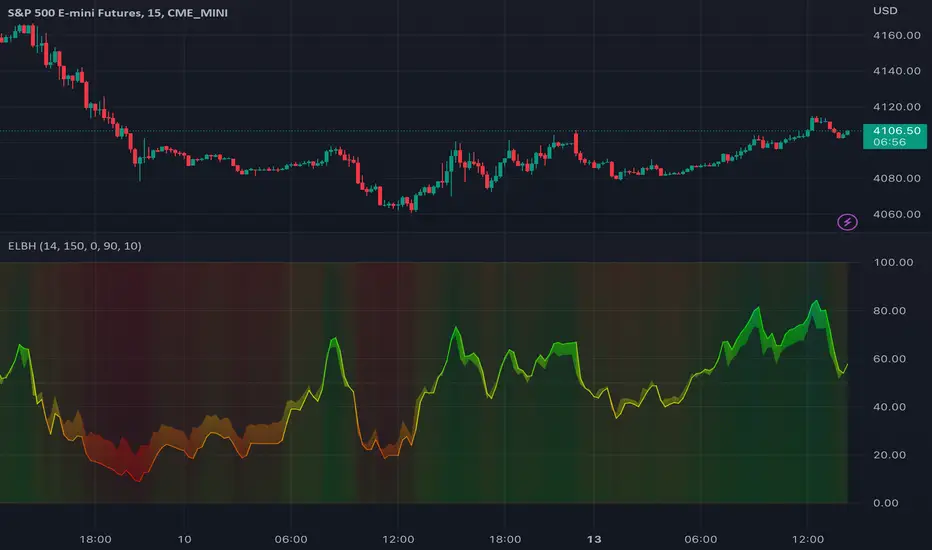
Following the example presented in the original publication, this script illustrates the proposed strategy using the Relative Strength Index (RSI) as a test indicator. It plots two series:
This script demonstrates that using the average of open and close as the calculation source results in a smoother indicator. To visually emphasize the advantage of this proposed trick, the script's color scheme is sensitive to both the RSI value and the difference between the two RSI data streams.
TASC's February 2023 edition of Traders' Tips includes an article titled "Every Little Bit Helps: Averaging The Open And Close To Reduce Noise" by John Ehlers. This code implements the numerical example from this article.
█ CONCEPTS
Using theories from digital signal processing as a starting point, John Ehlers argues that using the average of the open and close as the source time series of an indicator instead of using only the closing price can often lead to noise reduction in the output. This effect especially applies when there is no gap between the current bar's opening and the previous bar's closing prices. This trick can reduce noise in many common indicators such as the RSI, MACD, and Stochastic.
█ CALCULATIONS
Following the example presented in the original publication, this script illustrates the proposed strategy using the Relative Strength Index (RSI) as a test indicator. It plots two series:
- RSI calculated using only closing prices as its source.
- RSI of the same length as the first, but calculated using the average of open and close prices as its source, i.e. (open+close)/2.
This script demonstrates that using the average of open and close as the calculation source results in a smoother indicator. To visually emphasize the advantage of this proposed trick, the script's color scheme is sensitive to both the RSI value and the difference between the two RSI data streams.
开源脚本
秉承TradingView的精神,该脚本的作者将其开源,以便交易者可以查看和验证其功能。向作者致敬!您可以免费使用该脚本,但请记住,重新发布代码须遵守我们的网站规则。
Tools and ideas for all Pine coders: tradingview.com/u/PineCoders/
TASC: traders.com/
TASC: traders.com/
免责声明
这些信息和出版物并非旨在提供,也不构成TradingView提供或认可的任何形式的财务、投资、交易或其他类型的建议或推荐。请阅读使用条款了解更多信息。
开源脚本
秉承TradingView的精神,该脚本的作者将其开源,以便交易者可以查看和验证其功能。向作者致敬!您可以免费使用该脚本,但请记住,重新发布代码须遵守我们的网站规则。
Tools and ideas for all Pine coders: tradingview.com/u/PineCoders/
TASC: traders.com/
TASC: traders.com/
免责声明
这些信息和出版物并非旨在提供,也不构成TradingView提供或认可的任何形式的财务、投资、交易或其他类型的建议或推荐。请阅读使用条款了解更多信息。