Multi-Timeframe Stochastic Alert [tradeviZion]# Multi-Timeframe Stochastic Alert : Complete User Guide
## 1. Introduction
### What is the Multi-Timeframe Stochastic Alert?
The Multi-Timeframe Stochastic Alert is an advanced technical analysis tool that helps traders identify potential trading opportunities by analyzing momentum across multiple timeframes. It combines the power of the stochastic oscillator with multi-timeframe analysis to provide more reliable trading signals.
### Key Features and Benefits
- Simultaneous analysis of 6 different timeframes
- Advanced alert system with customizable conditions
- Real-time visual feedback with color-coded signals
- Comprehensive data table with instant market insights
- Motivational trading messages for psychological support
- Flexible theme support for comfortable viewing
### How it Can Help Your Trading
- Identify stronger trends by confirming momentum across multiple timeframes
- Reduce false signals through multi-timeframe confirmation
- Stay informed of market changes with customizable alerts
- Make more informed decisions with comprehensive market data
- Maintain trading discipline with clear visual signals
## 2. Understanding the Display
### The Stochastic Chart
The main chart displays three key components:
1. ** K-Line (Fast) **: The primary stochastic line (default color: green)
2. ** D-Line (Slow) **: The signal line (default color: red)
3. ** Reference Lines **:
- Overbought Level (80): Upper dashed line
- Middle Line (50): Center dashed line
- Oversold Level (20): Lower dashed line
### The Information Table
The table provides a comprehensive view of stochastic readings across all timeframes. Here's what each column means:
#### Column Explanations:
1. ** Timeframe **
- Shows the time period for each row
- Example: "5" = 5 minutes, "15" = 15 minutes, etc.
2. ** K Value **
- The fast stochastic line value (0-100)
- Higher values indicate stronger upward momentum
- Lower values indicate stronger downward momentum
3. ** D Value **
- The slow stochastic line value (0-100)
- Helps confirm momentum direction
- Crossovers with K-line can signal potential trades
4. ** Status **
- Shows current momentum with symbols:
- ▲ = Increasing (bullish)
- ▼ = Decreasing (bearish)
- Color matches the trend direction
5. ** Trend **
- Shows the current market condition:
- "Overbought" (above 80)
- "Bullish" (above 50)
- "Bearish" (below 50)
- "Oversold" (below 20)
#### Row Explanations:
1. ** Title Row **
- Shows "🎯 Multi-Timeframe Stochastic"
- Indicates the indicator is active
2. ** Header Row **
- Contains column titles
- Dark blue background for easy reading
3. ** Timeframe Rows **
- Six rows showing different timeframe analyses
- Each row updates independently
- Color-coded for easy trend identification
4. **Message Row**
- Shows rotating motivational messages
- Updates every 5 bars
- Helps maintain trading discipline
### Visual Indicators and Colors
- ** Green Background **: Indicates bullish conditions
- ** Red Background **: Indicates bearish conditions
- ** Color Intensity **: Shows strength of the signal
- ** Background Highlights **: Appear when alert conditions are met
## 3. Core Settings Groups
### Stochastic Settings
These settings control the core calculation of the stochastic oscillator.
1. ** Length (Default: 14) **
- What it does: Determines the lookback period for calculations
- Higher values (e.g., 21): More stable, fewer signals
- Lower values (e.g., 8): More sensitive, more signals
- Recommended:
* Day Trading: 8-14
* Swing Trading: 14-21
* Position Trading: 21-30
2. ** Smooth K (Default: 3) **
- What it does: Smooths the main stochastic line
- Higher values: Smoother line, fewer false signals
- Lower values: More responsive, but more noise
- Recommended:
* Day Trading: 2-3
* Swing Trading: 3-5
* Position Trading: 5-7
3. ** Smooth D (Default: 3) **
- What it does: Smooths the signal line
- Works in conjunction with Smooth K
- Usually kept equal to or slightly higher than Smooth K
- Recommended: Keep same as Smooth K for consistency
4. ** Source (Default: Close) **
- What it does: Determines price data for calculations
- Options: Close, Open, High, Low, HL2, HLC3, OHLC4
- Recommended: Stick with Close for most reliable signals
### Timeframe Settings
Controls the multiple timeframes analyzed by the indicator.
1. ** Main Timeframes (TF1-TF6) **
- TF1 (Default: 10): Shortest timeframe for quick signals
- TF2 (Default: 15): Short-term trend confirmation
- TF3 (Default: 30): Medium-term trend analysis
- TF4 (Default: 30): Additional medium-term confirmation
- TF5 (Default: 60): Longer-term trend analysis
- TF6 (Default: 240): Major trend confirmation
Recommended Combinations:
* Scalping: 1, 3, 5, 15, 30, 60
* Day Trading: 5, 15, 30, 60, 240, D
* Swing Trading: 15, 60, 240, D, W, M
2. ** Wait for Bar Close (Default: true) **
- What it does: Controls when calculations update
- True: More reliable but slightly delayed signals
- False: Faster signals but may change before bar closes
- Recommended: Keep True for more reliable signals
### Alert Settings
#### Main Alert Settings
1. ** Enable Alerts (Default: true) **
- Master switch for all alert notifications
- Toggle this off when you don't want any alerts
- Useful during testing or when you want to focus on visual signals only
2. ** Alert Condition (Options) **
- "Above Middle": Bullish momentum alerts only
- "Below Middle": Bearish momentum alerts only
- "Both": Alerts for both directions
- Recommended:
* Trending Markets: Choose direction matching the trend
* Ranging Markets: Use "Both" to catch reversals
* New Traders: Start with "Both" until you develop a specific strategy
3. ** Alert Frequency **
- "Once Per Bar": Immediate alerts during the bar
- "Once Per Bar Close": Alerts only after bar closes
- Recommended:
* Day Trading: "Once Per Bar" for quick reactions
* Swing Trading: "Once Per Bar Close" for confirmed signals
* Beginners: "Once Per Bar Close" to reduce false signals
#### Timeframe Check Settings
1. ** First Check (TF1) **
- Purpose: Confirms basic trend direction
- Alert Triggers When:
* For Bullish: Stochastic is above middle line (50)
* For Bearish: Stochastic is below middle line (50)
* For Both: Triggers in either direction based on position relative to middle line
- Settings:
* Enable/Disable: Turn first check on/off
* Timeframe: Default 5 minutes
- Best Used For:
* Quick trend confirmation
* Entry timing
* Scalping setups
2. ** Second Check (TF2) **
- Purpose: Confirms both position and momentum
- Alert Triggers When:
* For Bullish: Stochastic is above middle line AND both K&D lines are increasing
* For Bearish: Stochastic is below middle line AND both K&D lines are decreasing
* For Both: Triggers based on position and direction matching current condition
- Settings:
* Enable/Disable: Turn second check on/off
* Timeframe: Default 15 minutes
- Best Used For:
* Trend strength confirmation
* Avoiding false breakouts
* Day trading setups
3. ** Third Check (TF3) **
- Purpose: Confirms overall momentum direction
- Alert Triggers When:
* For Bullish: Both K&D lines are increasing (momentum confirmation)
* For Bearish: Both K&D lines are decreasing (momentum confirmation)
* For Both: Triggers based on matching momentum direction
- Settings:
* Enable/Disable: Turn third check on/off
* Timeframe: Default 30 minutes
- Best Used For:
* Major trend confirmation
* Swing trading setups
* Avoiding trades against the main trend
Note: All three conditions must be met simultaneously for the alert to trigger. This multi-timeframe confirmation helps reduce false signals and provides stronger trade setups.
#### Alert Combinations Examples
1. ** Conservative Setup **
- Enable all three checks
- Use "Once Per Bar Close"
- Timeframe Selection Example:
* First Check: 15 minutes
* Second Check: 1 hour (60 minutes)
* Third Check: 4 hours (240 minutes)
- Wider gaps between timeframes reduce noise and false signals
- Best for: Swing trading, beginners
2. ** Aggressive Setup **
- Enable first two checks only
- Use "Once Per Bar"
- Timeframe Selection Example:
* First Check: 5 minutes
* Second Check: 15 minutes
- Closer timeframes for quicker signals
- Best for: Day trading, experienced traders
3. ** Balanced Setup **
- Enable all checks
- Use "Once Per Bar"
- Timeframe Selection Example:
* First Check: 5 minutes
* Second Check: 15 minutes
* Third Check: 1 hour (60 minutes)
- Balanced spacing between timeframes
- Best for: All-around trading
### Visual Settings
#### Alert Visual Settings
1. ** Show Background Color (Default: true) **
- What it does: Highlights chart background when alerts trigger
- Benefits:
* Makes signals more visible
* Helps spot opportunities quickly
* Provides visual confirmation of alerts
- When to disable:
* If using multiple indicators
* When preferring a cleaner chart
* During manual backtesting
2. ** Background Transparency (Default: 90) **
- Range: 0 (solid) to 100 (invisible)
- Recommended Settings:
* Clean Charts: 90-95
* Multiple Indicators: 85-90
* Single Indicator: 80-85
- Tip: Adjust based on your chart's overall visibility
3. ** Background Colors **
- Bullish Background:
* Default: Green
* Indicates upward momentum
* Customizable to match your theme
- Bearish Background:
* Default: Red
* Indicates downward momentum
* Customizable to match your theme
#### Level Settings
1. ** Oversold Level (Default: 20) **
- Traditional Setting: 20
- Adjustable Range: 0-100
- Usage:
* Lower values (e.g., 10): More conservative
* Higher values (e.g., 30): More aggressive
- Trading Applications:
* Potential bullish reversal zone
* Support level in uptrends
* Entry point for long positions
2. ** Overbought Level (Default: 80) **
- Traditional Setting: 80
- Adjustable Range: 0-100
- Usage:
* Lower values (e.g., 70): More aggressive
* Higher values (e.g., 90): More conservative
- Trading Applications:
* Potential bearish reversal zone
* Resistance level in downtrends
* Exit point for long positions
3. ** Middle Line (Default: 50) **
- Purpose: Trend direction separator
- Applications:
* Above 50: Bullish territory
* Below 50: Bearish territory
* Crossing 50: Potential trend change
- Trading Uses:
* Trend confirmation
* Entry/exit trigger
* Risk management level
#### Color Settings
1. ** Bullish Color (Default: Green) **
- Used for:
* K-Line (Main stochastic line)
* Status symbols when trending up
* Trend labels for bullish conditions
- Customization:
* Choose colors that stand out
* Match your trading platform theme
* Consider color blindness accessibility
2. ** Bearish Color (Default: Red) **
- Used for:
* D-Line (Signal line)
* Status symbols when trending down
* Trend labels for bearish conditions
- Customization:
* Choose contrasting colors
* Ensure visibility on your chart
* Consider monitor settings
3. ** Neutral Color (Default: Gray) **
- Used for:
* Middle line (50 level)
- Customization:
* Should be less prominent
* Easy on the eyes
* Good background contrast
### Theme Settings
1. **Color Theme Options**
- Dark Theme (Default):
* Dark background with white text
* Optimized for dark chart backgrounds
* Reduces eye strain in low light
- Light Theme:
* Light background with black text
* Better visibility in bright conditions
- Custom Theme:
* Use your own color preferences
2. ** Available Theme Colors **
- Table Background
- Table Text
- Table Headers
Note: The theme affects only the table display colors. The stochastic lines and alert backgrounds use their own color settings.
### Table Settings
#### Position and Size
1. ** Table Position **
- Options:
* Top Right (Default)
* Middle Right
* Bottom Right
* Top Left
* Middle Left
* Bottom Left
- Considerations:
* Chart space utilization
* Personal preference
* Multiple monitor setups
2. ** Text Sizes **
- Title Size Options:
* Tiny: Minimal space usage
* Small: Compact but readable
* Normal (Default): Standard visibility
* Large: Enhanced readability
* Huge: Maximum visibility
- Data Size Options:
* Recommended: One size smaller than title
* Adjust based on screen resolution
* Consider viewing distance
3. ** Empowering Messages **
- Purpose:
* Maintain trading discipline
* Provide psychological support
* Remind of best practices
- Rotation:
* Changes every 5 bars
* Categories include:
- Market Wisdom
- Strategy & Discipline
- Mindset & Growth
- Technical Mastery
- Market Philosophy
## 4. Setting Up for Different Trading Styles
### Day Trading Setup
1. **Timeframes**
- Primary: 5, 15, 30 minutes
- Secondary: 1H, 4H
- Alert Settings: "Once Per Bar"
2. ** Stochastic Settings **
- Length: 8-14
- Smooth K/D: 2-3
- Alert Condition: Match market trend
3. ** Visual Settings **
- Background: Enabled
- Transparency: 85-90
- Theme: Based on trading hours
### Swing Trading Setup
1. ** Timeframes **
- Primary: 1H, 4H, Daily
- Secondary: Weekly
- Alert Settings: "Once Per Bar Close"
2. ** Stochastic Settings **
- Length: 14-21
- Smooth K/D: 3-5
- Alert Condition: "Both"
3. ** Visual Settings **
- Background: Optional
- Transparency: 90-95
- Theme: Personal preference
### Position Trading Setup
1. ** Timeframes **
- Primary: Daily, Weekly
- Secondary: Monthly
- Alert Settings: "Once Per Bar Close"
2. ** Stochastic Settings **
- Length: 21-30
- Smooth K/D: 5-7
- Alert Condition: "Both"
3. ** Visual Settings **
- Background: Disabled
- Focus on table data
- Theme: High contrast
## 5. Troubleshooting Guide
### Common Issues and Solutions
1. ** Too Many Alerts **
- Cause: Settings too sensitive
- Solutions:
* Increase timeframe intervals
* Use "Once Per Bar Close"
* Enable fewer timeframe checks
* Adjust stochastic length higher
2. ** Missed Signals **
- Cause: Settings too conservative
- Solutions:
* Decrease timeframe intervals
* Use "Once Per Bar"
* Enable more timeframe checks
* Adjust stochastic length lower
3. ** False Signals **
- Cause: Insufficient confirmation
- Solutions:
* Enable all three timeframe checks
* Use larger timeframe gaps
* Wait for bar close
* Confirm with price action
4. ** Visual Clarity Issues **
- Cause: Poor contrast or overlap
- Solutions:
* Adjust transparency
* Change theme settings
* Reposition table
* Modify color scheme
### Best Practices
1. ** Getting Started **
- Start with default settings
- Use "Both" alert condition
- Enable all timeframe checks
- Wait for bar close
- Monitor for a few days
2. ** Fine-Tuning **
- Adjust one setting at a time
- Document changes and results
- Test in different market conditions
- Find your optimal timeframe combination
- Balance sensitivity with reliability
3. ** Risk Management **
- Don't trade against major trends
- Confirm signals with price action
- Use appropriate position sizing
- Set clear stop losses
- Follow your trading plan
4. ** Regular Maintenance **
- Review settings weekly
- Adjust for market conditions
- Update color scheme for visibility
- Clean up chart regularly
- Maintain trading journal
## 6. Tips for Success
1. ** Entry Strategies **
- Wait for all timeframes to align
- Confirm with price action
- Use proper position sizing
- Consider market conditions
2. ** Exit Strategies **
- Trail stops using indicator levels
- Take partial profits at targets
- Honor your stop losses
- Don't fight the trend
3. ** Psychology **
- Stay disciplined with settings
- Don't override system signals
- Keep emotions in check
- Learn from each trade
4. ** Continuous Improvement **
- Record your trades
- Review performance regularly
- Adjust settings gradually
- Stay educated on markets
Alertsignals

Ensemble Alerts█ OVERVIEW
This indicator creates highly customizable alert conditions and messages by combining several technical conditions into groups , which users can specify directly from the "Settings/Inputs" tab. It offers a flexible framework for building and testing complex alert conditions without requiring code modifications for each adjustment.
█ CONCEPTS
Ensemble analysis
Ensemble analysis is a form of data analysis that combines several "weaker" models to produce a potentially more robust model. In a trading context, one of the most prevalent forms of ensemble analysis is the aggregation (grouping) of several indicators to derive market insights and reinforce trading decisions. With this analysis, traders typically inspect multiple indicators, signaling trade actions when specific conditions or groups of conditions align.
Simplifying ensemble creation
Combining indicators into one or more ensembles can be challenging, especially for users without programming knowledge. It usually involves writing custom scripts to aggregate the indicators and trigger trading alerts based on the confluence of specific conditions. Making such scripts customizable via inputs poses an additional challenge, as it often involves complicated input menus and conditional logic.
This indicator addresses these challenges by providing a simple, flexible input menu where users can easily define alert criteria by listing groups of conditions from various technical indicators in simple text boxes . With this script, you can create complex alert conditions intuitively from the "Settings/Inputs" tab without ever writing or modifying a single line of code. This framework makes advanced alert setups more accessible to non-coders. Additionally, it can help Pine programmers save time and effort when testing various condition combinations.
█ FEATURES
Configurable alert direction
The "Direction" dropdown at the top of the "Settings/Inputs" tab specifies the allowed direction for the alert conditions. There are four possible options:
• Up only : The indicator only evaluates upward conditions.
• Down only : The indicator only evaluates downward conditions.
• Up and down (default): The indicator evaluates upward and downward conditions, creating alert triggers for both.
• Alternating : The indicator prevents alert triggers for consecutive conditions in the same direction. An upward condition must be the first occurrence after a downward condition to trigger an alert, and vice versa for downward conditions.
Flexible condition groups
This script features six text inputs where users can define distinct condition groups (ensembles) for their alerts. An alert trigger occurs if all the conditions in at least one group occur.
Each input accepts a comma-separated list of numbers with optional spaces (e.g., "1, 4, 8"). Each listed number, from 1 to 35, corresponds to a specific individual condition. Below are the conditions that the numbers represent:
1 — RSI above/below threshold
2 — RSI below/above threshold
3 — Stoch above/below threshold
4 — Stoch below/above threshold
5 — Stoch K over/under D
6 — Stoch K under/over D
7 — AO above/below threshold
8 — AO below/above threshold
9 — AO rising/falling
10 — AO falling/rising
11 — Supertrend up/down
12 — Supertrend down/up
13 — Close above/below MA
14 — Close below/above MA
15 — Close above/below open
16 — Close below/above open
17 — Close increase/decrease
18 — Close decrease/increase
19 — Close near Donchian top/bottom (Close > (Mid + HH) / 2)
20 — Close near Donchian bottom/top (Close < (Mid + LL) / 2)
21 — New Donchian high/low
22 — New Donchian low/high
23 — Rising volume
24 — Falling volume
25 — Volume above average (Volume > SMA(Volume, 20))
26 — Volume below average (Volume < SMA(Volume, 20))
27 — High body to range ratio (Abs(Close - Open) / (High - Low) > 0.5)
28 — Low body to range ratio (Abs(Close - Open) / (High - Low) < 0.5)
29 — High relative volatility (ATR(7) > ATR(40))
30 — Low relative volatility (ATR(7) < ATR(40))
31 — External condition 1
32 — External condition 2
33 — External condition 3
34 — External condition 4
35 — External condition 5
These constituent conditions fall into three distinct categories:
• Directional pairs : The numbers 1-22 correspond to pairs of opposing upward and downward conditions. For example, if one of the inputs includes "1" in the comma-separated list, that group uses the "RSI above/below threshold" condition pair. In this case, the RSI must be above a high threshold for the group to trigger an upward alert, and the RSI must be below a defined low threshold to trigger a downward alert.
• Non-directional filters : The numbers 23-30 correspond to conditions that do not represent directional information. These conditions act as filters for both upward and downward alerts. Traders often use non-directional conditions to refine trending or mean reversion signals. For instance, if one of the input lists includes "30", that group uses the "Low relative volatility" condition. The group can trigger an upward or downward alert only if the 7-period Average True Range (ATR) is below the 40-period ATR.
• External conditions : The numbers 31-35 correspond to external conditions based on the plots from other indicators on the chart. To set these conditions, use the source inputs in the "External conditions" section near the bottom of the "Settings/Inputs" tab. The external value can represent an upward, downward, or non-directional condition based on the following logic:
▫ Any value above 0 represents an upward condition.
▫ Any value below 0 represents a downward condition.
▫ If the checkbox next to the source input is selected, the condition becomes non-directional . Any group that uses the condition can trigger upward or downward alerts only if the source value is not 0.
To learn more about using plotted values from other indicators, see this article in our Help Center and the Source input section of our Pine Script™ User Manual.
Group markers
Each comma-separated list represents a distinct group , where all the listed conditions must occur to trigger an alert. This script assigns preset markers (names) to each condition group to make the active ensembles easily identifiable in the generated alert messages and labels. The markers assigned to each group use the format "M", where "M" is short for "Marker" and "x" is the group number. The titles of the inputs at the top of the "Settings/Inputs" tab show these markers for convenience.
For upward conditions, the labels and alert messages show group markers with upward triangles (e.g., "M1▲"). For downward conditions, they show markers with downward triangles (e.g., "M1▼").
NOTE: By default, this script populates the "M1" field with a pre-configured list for a mean reversion group ("2,18,24,28"). The other fields are empty. If any "M*" input does not contain a value, the indicator ignores it in the alert calculations.
Custom alert messages
By default, the indicator's alert message text contains the activated markers and their direction as a comma-separated list. Users can override this message for upward or downward alerts with the two text fields at the bottom of the "Settings/Inputs" tab. When the fields are not empty , the alerts use that text instead of the default marker list.
NOTE: This script generates alert triggers, not the alerts themselves. To set up an alert based on this script's conditions, open the "Create Alert" dialog box, then select the "Ensemble Alerts" and "Any alert() function call" options in the "Condition" tabs. See the Alerts FAQ in our Pine Script™ User Manual for more information.
Condition visualization
This script offers organized visualizations of its conditions, allowing users to inspect the behaviors of each condition alongside the specified groups. The key visual features include:
1) Conditional plots
• The indicator plots the history of each individual condition, excluding the external conditions, as circles at different levels. Opposite conditions appear at positive and negative levels with the same absolute value. The plots for each condition show values only on the bars where they occur.
• Each condition's plot is color-coded based on its type. Aqua and orange plots represent opposing directional conditions, and purple plots represent non-directional conditions. The titles of the plots also contain the condition numbers to which they apply.
• The plots in the separate pane can be turned on or off with the "Show plots in pane" checkbox near the top of the "Settings/Inputs" tab. This input only toggles the color-coded circles, which reduces the graphical load. If you deactivate these visuals, you can still inspect each condition from the script's status line and the Data Window.
• As a bonus, the indicator includes "Up alert" and "Down alert" plots in the Data Window, representing the combined upward and downward ensemble alert conditions. These plots are also usable in additional indicator-on-indicator calculations.
2) Dynamic labels
• The indicator draws a label on the main chart pane displaying the activated group markers (e.g., "M1▲") each time an alert condition occurs.
• The labels for upward alerts appear below chart bars. The labels for downward alerts appear above the bars.
NOTE: This indicator can display up to 500 labels because that is the maximum allowed for a single Pine script.
3) Background highlighting
• The indicator can highlight the main chart's background on bars where upward or downward condition groups activate. Use the "Highlight background" inputs in the "Settings/Inputs" tab to enable these highlights and customize their colors.
• Unlike the dynamic labels, these background highlights are available for all chart bars, irrespective of the number of condition occurrences.
█ NOTES
• This script uses Pine Script™ v6, the latest version of TradingView's programming language. See the Release notes and Migration guide to learn what's new in v6 and how to convert your scripts to this version.
• This script imports our new Alerts library, which features functions that provide high-level simplicity for working with complex compound conditions and alerts. We used the library's `compoundAlertMessage()` function in this indicator. It evaluates items from "bool" arrays in groups specified by an array of strings containing comma-separated index lists , returning a tuple of "string" values containing the marker of each activated group.
• The script imports the latest version of the ta library to calculate several technical indicators not included in the built-in `ta.*` namespace, including Double Exponential Moving Average (DEMA), Triple Exponential Moving Average (TEMA), Fractal Adaptive Moving Average (FRAMA), Tilson T3, Awesome Oscillator (AO), Full Stochastic (%K and %D), SuperTrend, and Donchian Channels.
• The script uses the `force_overlay` parameter in the label.new() and bgcolor() calls to display the drawings and background colors in the main chart pane.
• The plots and hlines use the available `display.*` constants to determine whether the visuals appear in the separate pane.
Look first. Then leap.

New Bar AlertThis is probably the simplest indicator on Tradingview, it generates an alert on every new bar.
Useful for strategies where you only need chart attention at the new bar, see if you have a setup.
Helps not having to stare at the charts, the alert will tell you when it's time to take a look.
Works on all timeframes but in order to keep your sanity, best used on higher timeframes, 5mins and up.
Dynamic Buy/Sell VisualizationDynamic Trend Visualization Indicator
Description:
This simple and easy to use indicator has helped me stay in trades longer.
This indicator is designed to visually represent potential buy and sell signals based on the crossover of two Simple Moving Averages (SMA). It's crafted to assist traders in identifying trend directions in a straightforward manner, making it an excellent tool for both beginners and experienced traders.
Features:
Customizable Moving Averages: Users can adjust the period length for both short-term (default: 10) and long-term (default: 50) SMAs to suit their trading strategy.
Visual Signals: Dynamic lines appear at the points of SMA crossover, with labels to indicate 'BUY' or 'SELL' opportunities.
Color and Style Customization: Customize the appearance of the buy and sell lines for better chart readability.
Alert Functionality: Alerts are set up to notify users when a crossover indicating a buy or sell condition occurs.
How It Works:
A 'BUY' signal is generated when the short-term SMA crosses above the long-term SMA, suggesting an upward trend.
A 'SELL' signal is indicated when the short-term SMA crosses below the long-term SMA, pointing to a potential downward trend.
Use Cases:
Trend Following: Ideal for markets with clear trends. For example, if trading EUR/USD on a daily chart, setting the short SMA to 10 days and the long SMA to 50 days might help in capturing longer-term trends.
Scalping: In a volatile market, setting shorter periods (e.g., 5 for short SMA and 20 for long SMA) might catch quicker trend changes, suitable for scalping.
Examples of how to use
* Short-term for Quick Trades:
SMA 5 and SMA 21:
Purpose: This combination is tailored for day traders or those looking to engage in scalping. The 5 SMA will react rapidly to price changes, providing early signals for buy or sell opportunities. The 21 SMA, being a Fibonacci number, offers a slightly longer-term view to confirm the short-term trend, helping to filter out minor fluctuations that might lead to false signals.
* Middle-term for Swing Trading:
SMA 10 and SMA 50:
Purpose: Suited for swing traders who aim to capitalize on medium-term trends. The 10 SMA picks up on immediate market movements, while the 50 SMA gives insight into the medium-term direction. This setup helps in identifying when a short-term trend aligns with a longer-term trend, providing a good balance for trades that might last several days to a couple of weeks.
* Long-term Trading:
SMA 50 and SMA 200:
Purpose: Investors focusing on long-term trends would benefit from this pair. The crossover of the 50 SMA over the 200 SMA can indicate the beginning or end of major market trends, ideal for making decisions about long-term holdings that might span months or years.
Example Strategy if not using the Buy / Sell Label Alerts:
Entry Signal: Enter a long position when the shorter SMA crosses above the longer SMA. For example:
SMA 10 crosses above SMA 50 for a medium-term bullish signal.
Exit Signal: Consider exiting or initiating a short position when:
SMA 10 crosses below SMA 50, suggesting a bearish turn in the medium-term trend.
Confirmation: Use these crossovers in conjunction with other indicators like volume or momentum indicators for better confirmation. For instance, if you're using the 5/21 combination, look for volume spikes on crossovers to confirm the move's strength.
When Not to Use:
Sideways or Range-Bound Markets: The indicator might generate many false signals in a non-trending market, leading to potential losses.
High Volatility Without Clear Trends: Rapid price movements without a consistent direction can result in misleading crossovers.
As a Standalone Tool: It should not be used in isolation. Combining with other indicators like RSI or MACD for confirmation can enhance trading decisions.
Practical Example:
Buy Signal: If you're watching Apple Inc. (AAPL) on a weekly chart, a crossover where the 10-week SMA moves above the 50-week SMA could suggest a buying opportunity, especially if confirmed by volume increase or other technical indicators.
Sell Signal: Conversely, if the 10-week SMA dips below the 50-week SMA, it might be time to consider selling, particularly if other bearish signals are present.
Conclusion:
The "Dynamic Trend Visualization" indicator provides a visual aid for trend-following strategies, offering customization and alert features to streamline the trading process. However, it's crucial to use this in conjunction with other analysis methods to mitigate the risks of false signals or market anomalies.
Legal Disclaimer:
This indicator is for educational purposes only. It does not guarantee profits or provide investment advice. Trading involves risk; please conduct thorough or consult with a financial advisor. The creator is not responsible for any losses incurred. By using this indicator, you agree to these terms.

Outlier changes alertAn indicator that calculates click (price change), percentage change, and Z-score changes while displaying outliers based on defined ranges.
Outlier Detection:
Mark outliers (for price, percentage, Z-score) based on user-defined thresholds. For example, any price movement exceeding a certain Z-score or percentage change could be marked as an outlier and displayed on chart.
Indicator Overview:
1. Click (Price Change):
Calculate the absolute price change from one period to another (e.g., from the current closing price to the previous closing price).
2. Percentage Change:
Calculate the percentage price change over a specific period, showing how much the price has changed in relative terms compared to the previous price.
3. Z-Score:
Compute the Z-score to standardize the price change relative to its historical average and standard deviation. The Z-score helps in detecting whether a price movement is an outlier or falls within a normal range of volatility.

Alert Sender Library [TradingFinder]Library "AlertSenderLibrary_TradingFinder"
🔵 Introduction
The "Alert Sender Library" is a management and production program for "Alert Messages" that enables the creation of unique messages for any type of signal generated by indicators or strategies.
These messages include the direction of the signal, symbol, time frame, the date and time the condition was triggered, prices related to the signal, and a personal message from you. To make better and more optimal use of this "library", you should carefully study " Key Features" and "How to Use".
🔵 Key Features
Automatic Detection of Appropriate Type :
Using two parameters, "AlertType" and "DetectionType", which you must enter at the beginning into the "AlertSender" function, the type of the alert message is determined.
For example, if you select one of the "DetectionType"s such as "Order Block Signal", "Signal", and "Setup", your alert type will be chosen based on "Long" and "Short". Whether it's "Long" or "Short" depends on the "AlertType" you have set to either "Bullish" or "Bearish".
Automatic Symbol Detection :
Whenever you add an alert for a specific symbol, if you want the name of that symbol to be in your message text, you must manually write the name of the symbol in your message. One of the capabilities of the "Alert Sender" is the automatic detection of the symbol and adding it to the message text.
Automatic Time Frame Detection :
When adding your alert, the "Alert Sender" detects the time frame of the symbol you intend to add the alert for and adds it to the text. This feature is very practical and can prevent traders from making mistakes.
For example, a trader might add alerts for a specific symbol using a specific indicator in different time frames, taking the main signal in the 1-hour time frame and only a confirmation signal in the 15-minute time frame. This feature helps to identify in which time frame the signal is set.
Detection of Date and Time When the Signal is Triggered :
You can have the date and time at the moment the message is sent. This feature has various uses. For example, if you use the Webhook URL feature to send messages to a Telegram channel, there might be issues with alert delivery on your server, causing delays, and you might receive the message when it has lost its validity.
With this feature, you can match the sending time of the message from TradingView with the receipt time in your messenger and detect if there is a delay in message delivery.
Important :
You can also set the Time Zone you wish to receive the date and time based on.
Display of "Key Prices" :
Key prices can vary based on the type of signals. For example, when the "DetectionType" is in "Order Block Signal" mode, the key prices are the "Distal" and "Proximal" prices. Or if the "DetectionType" is in "Setup" mode, the key prices are "Entry", "Stop Loss", and "Take Profit".
Receipt of Personal "Messages" :
You can enter your personal message using "input.string" or "input.text_area" in addition to the messages that are automatically created.
Beautiful and Functional Display of Messages :
The titles of messages sent by "AlertSender" are displayed using related emojis to prevent mistakes due to visual errors, enhancing beauty.
🔵 How to Use
🟣 Familiarity with Function and Parameters
AlertSender(Condition, Alert, AlertName, AlertType, DetectionType, SetupData, Frequency, UTC, MoreInfo, Message, o, h, l, c, Entry, TP, SL, Distal, Proximal)
Parameters:
- Condition (bool)
- Alert (string)
- AlertName (string)
- AlertType (string)
- DetectionType (string)
- SetupData (string)
- Frequency (string)
- UTC (string)
- MoreInfo (string)
- Message (string)
- o (float)
- h (float)
- l (float)
- c (float)
- Entry (float)
- TP (float)
- SL (float)
- Distal (float)
- Proximal (float)
To add "Alert Sender Library", you must first add the following code to your script.
import TFlab/AlertSenderLibrary_TradingFinder/1
🟣 Parameters
"Condition" : This parameter is a Boolean. You need to set it based on the condition that, when met (or fired), you want to receive an alert. The output should be either "true" or "false".
"Alert" : This parameter accepts one of two inputs, "On" or "Off". If set to "On", the alarm is active; if "Off", the alarm is deactivated. This input is useful when you have numerous alerts in an indicator or strategy and need to activate only a few of them. "Alert" is a string parameter.
Alert = input.string('On', 'Alert', , 'If you turn on the Alert, you can receive alerts and notifications after setting the "Alert".', group = 'Alert')
"AlertName" : This is a string parameter where you can enter the name you choose for your alert.
AlertName = input.string('Order Blocks Finder ', 'Alert Name', group = 'Alert')
"AlertType" : The inputs for this parameter are "Bullish" or "Bearish". If the condition selected in the "Condition" parameter is of a bullish bias, you should set this parameter to "Bullish", and if the condition is of a bearish bias, it should be set to "Bearish". "AlertType" is a string parameter.
"DetectionType" : This parameter's predefined inputs include "Order Block Signal", "Signal", "Setup", and "Analysis". You may provide other inputs, but some functionalities, like "Key Price", might be lost. "DetectionType" is a string parameter.
"SetupData" :
If "DetectionType" is set to "Setup", you must specify "SetupData" as either "Basic" or "Full". In "Basic" mode, only the "Entry" price needs to be defined in the function, and "TP" (Take Profit) and "SL" (Stop Loss) can be any number or NA. In "Full" mode, you need to define "Entry", "SL", and "TP". "Setup" is a string parameter.
"Frequency" : This string parameter defines the announcement frequency. Choices include: "All" (activates the alert every time the function is called), "Once Per Bar" (activates the alert only on the first call within the bar), and "Once Per Bar Close" (the alert is activated only by a call at the last script execution of the real-time bar upon closing). The default setting is "Once per Bar".
Frequency = input.string('Once Per Bar', 'Message Frequency', , 'The triggering frequency. Possible values are: All (all function calls trigger the alert), Once Per Bar (the first function call during the bar triggers the alert), Per Bar Close (the function call triggers the alert only when it occurs during the last script iteration of the real-time bar, when it closes). The default is alert.freq_once_per_bar.', group = 'Alert')
"UTC" : With this parameter, you can set the Time Zone for the date and time of the alert's dispatch. "UTC" is a string parameter and can be set as "UTC-4", "UTC+1", "UTC+9", or any other Time Zone.
UTC = input.string('UTC', 'Show Alert time by Time Zone', group = 'Alert')
"MoreInfo" : This parameter can take one of two inputs, "On" or "Off", which are strings. Additional information, including "Time" and "Key Price", is included. If set to "On", this information is received; if "Off", it is not displayed in the sent message.
MoreInfo = input.string('On', 'Display More Info', , group = 'Alert')
"Message" : This parameter captures the user's personal message through an input and displays it at the end of the sent message. It is a string input.
MessageBull = input.text_area('Long Position', 'Long Signal Message', group = 'Alert') MessageBear = input.text_area('Short Position', 'Short Signal Message', group = 'Alert')
"o" (Open Price): A floating-point number representing the opening price of the candle. This input is necessary when the "DetectionType" is set to "Signal". Otherwise, it can be any number or "na".
"h" (High Price): A float variable for the highest price of the candle. Required when "DetectionType" is "Signal"; in other cases, any number or "na" is acceptable.
"l" (Low Price): A float representing the lowest price of the candle. This field must be filled if "DetectionType" is "Signal". If not, it can be any number or "na".
"c" (Close Price): A floating-point variable indicating the closing price of the candle. Needed for "Signal" type detections; otherwise, it can take any value or "na".
"Entry" : A float variable indicating the entry price into a trading setup. This is relevant when "DetectionType" is in "Setup" mode. In other scenarios, it can be any number or "na". It denotes the price at which the trade setup is entered.
"TP" (Take Profit): A float that is necessary when "DetectionType" is "Setup" and "SetupData" is "Full". Otherwise, it can be any number or "na". It signifies the price target for taking profits in a trading setup.
"SL" (Stop Loss): A float required when "DetectionType" is "Setup" and "SetupData" is "Full". It can be any number or "na" in other cases. This value represents the price at which a stop loss is set to limit losses.
"Distal" : A float important for "Order Block Signal" detection. It can be any number or "na" if not in use. This variable indicates the price reaching the distal line of an order block.
"Proximal" : A float needed for "Order Block Signal" detection mode. It can take any value or "na" otherwise. It marks the price reaching the proximal line of an order block.

Alligator + Fractals + Divergent & Squat Bars + Signal AlertsThe indicator includes Williams Alligator, Williams Fractals, Divergent Bars, Market Facilitation Index, Highest and Lowest Bars, maximum and minimum peak of Awesome Oscillator, and signal alerts based on Bill Williams' Profitunity strategy.
MFI and Awesome Oscillator
According to the Market Facilitation Index Oscillator, the Squat bar is colored blue, all other bars are colored according to the Awesome Oscillator color, except for the Fake bars, colored with a lighter AO color. In the indicator settings, you can enable the display of "Green" bars (in the "Green Bars > Show" field). In the indicator style settings, you can disable changing the color of bars in accordance with the AO color (in the "AO bars" field), including changing the color for Fake bars (in the "Fake AO bars" field).
MFI is calculated using the formula: (high - low) / volume.
A Squat bar means that, compared to the previous bar, its MFI has decreased and at the same time its volume has increased, i.e. MFI < previous bar and volume > previous bar. A sign of a possible price reversal, so this is a particularly important signal.
A Fake bar is the opposite of a Squat bar and means that, compared to the previous bar, its MFI has increased and at the same time its volume has decreased, i.e. MFI > previous bar and volume < previous bar.
A "Green" bar means that, compared to the previous bar, its MFI has increased and at the same time its volume has increased, i.e. MFI > previous bar and volume > previous bar. A sign of trend continuation. But a more significant trend confirmation or warning of a possible reversal is the Awesome Oscillator, which measures market momentum by calculating the difference between the 5 Period and 34 Period Simple Moving Averages (SMA 5 - SMA 34) based on the midpoints of the bars (hl2). Therefore, by default, the "Green" bars and their opposite "Fade" bars are colored according to the color of the Awesome Oscillator.
According to Bill Williams' Profitunity strategy, using the Awesome Oscillator, the third Elliott wave is determined by the maximum peak of AO in the range from 100 to 140 bars. The presence of divergence between the maximum AO peak and the subsequent lower AO peak in this interval also warns of a possible correction, especially if the AO crosses the zero line between these AO peaks. Therefore, the chart additionally displays the prices of the highest and lowest bars, as well as the maximum or minimum peak of AO in the interval of 140 bars from the last bar. In the indicator settings, you can hide labels, lines, change the number of bars and any parameters for the AO indicator - method (SMA, Smoothed SMA, EMA and others), length, source (open, high, low, close, hl2 and others).
Bullish Divergent bar
🟢 A buy signal (Long) is a Bullish Divergent bar with a green circle displayed above it if such a bar simultaneously meets all of the following conditions:
The high of the bar is below all lines of the Alligator indicator.
The closing price of the bar is above its middle, i.e. close > (high + low) / 2.
The low of the bar is below the low of 2 previous bars or below the low of one previous bar, and the low of the second previous bar is a lower fractal (▼). By default, Divergent bars are not displayed, the low of which is lower than the low of only one previous bar and the low of the 2nd previous bar is not a lower fractal (▼), but you can enable the display of any Divergent bars in the indicator settings (by setting the value "no" in the " field Divergent Bars > Filtration").
The following conditions strengthen the Bullish Divergent bar signal:
The opening price of the bar, as well as the closing price, is higher than its middle, i.e. Open > (high + low) / 2.
The high of the bar is below all lines of the open Alligator indicator, i.e. the green line (Lips) is below the red line (Teeth) and the red line is below the blue line (Jaw). In this case, the color of the circle above the Bullish Divergent bar is dark green.
Squat Divergent bar.
The bar following the Bullish Divergent bar corresponds to the green color of the Awesome Oscillator.
Divergence on Awesome Oscillator.
Formation of the lower fractal (▼), in which the low of the Divergent bar is the peak of the fractal.
Bearish Divergent bar
🔴 A signal to sell (Short) is a Bearish Divergent bar under which a red circle is displayed if such a bar simultaneously meets all the following conditions:
The low of the bar is above all lines of the Alligator indicator.
The closing price of the bar is below its middle, i.e. close < (high + low) / 2.
The high of the bar is higher than the high of 2 previous bars or higher than the high of one previous bar, and the high of the second previous bar is an upper fractal (▲). By default, Divergent bars are not displayed, the high of which is higher than the high of only one previous bar and the high of the 2nd previous bar is not an upper fractal (▲), but you can enable the display of any Divergent bars in the indicator settings (by setting the value "no" in the " field Divergent Bars > Filtration").
The following conditions strengthen the Bearish Divergent bar signal:
The opening price of the bar, as well as the closing price, is below its middle, i.e. open < (high + low) / 2.
The low of the bar is above all lines of the open Alligator indicator, i.e. the green line (Lips) is above the red line (Teeth) and the red line is above the blue line (Jaw). In this case, the color of the circle under the Bearish Divergent bar is dark red.
Squat Divergent bar.
The bar following the Bearish Divergent bar corresponds to the red color of the Awesome Oscillator.
Divergence on Awesome Oscillator.
Formation of the upper fractal (▲), in which the high of the Divergent bar is the peak of the fractal.
Alligator lines crossing
Bars crossing the green line (Lips) of the open Alligator indicator is the first warning of a possible correction (price rollback) if one of the following conditions is met:
If the bar closed below the Lips line, which is above the Teeth line, and the Teeth line is above the Jaw line, while the closing price of the previous bar is above the Lips line.
If the bar closed above the Lips line, which is below the Teeth line, and the Teeth line is below the Jaw line, while the closing price of the previous bar is below the Lips line.
The intersection of all open Alligator lines by bars is a sign of a deep correction and a warning of a possible trend change.
Frequent intersection of Alligator lines with each other is a sign of a sideways trend (flat).
Signal Alerts
To receive notifications about signals when creating an alert, you must select the condition "Any alert() function is call", in which case notifications will arrive in the following format:
D — timeframe, for example: D, 4H, 15m.
🟢 BDB⎾ - a signal for a Bullish Divergent bar to buy (Long), triggers once after the bar closes and includes additional signals:
/// — if Alligator is open.
⏉ — if the opening price of the bar, as well as the closing price, is above its middle.
+ Squat 🔷 - Squat bar or + Green ↑ - "Green" bar or + Fake ↓ - Fake bar.
+ AO 🟩 - if after the Divergent bar closes, the oscillator color change for the next bar corresponds the green color of the Awesome Oscillator. ┴/┬ — AO above/below the zero line. ∇ — if there is divergence on AO in the interval of 140 bars from the last bar.
🔴 BDB⎿ - a signal for a Bearish Divergent bar to sell (Short), triggers once after the bar closes and includes additional signals:
/// — if Alligator is open.
⏊ — if the opening price of the bar, as well as the closing price, is below its middle.
+ Squat 🔷 - Squat bar or + Green ↑ - "Green" bar or + Fake ↓ - Fake bar.
+ AO 🟥 - if after the Divergent bar closes, the oscillator color change for the next bar corresponds to the red color of the Awesome Oscillator. ┴/┬ — AO above/below the zero line. ∇ — if there is divergence on AO in the interval of 140 bars from the last bar.
Alert for bars crossing the green line (Lips) of the open Alligator indicator (can be disabled in the indicator settings in the "Alligator > Enable crossing lips alerts" field):
🔴 Crossing Lips ↓ - if the bar closed below the Lips line, which is above than the other lines, while the closing price of the previous bar is above the Lips line.
🟢 Crossing Lips ↑ - if the bar closed above the Lips line, which is below the other lines, while the closing price of the previous bar is below the Lips line.
The fractal signal is triggered after the second bar closes, completing the formation of the fractal, if alerts about fractals are enabled in the indicator settings (the "Fractals > Enable alerts" field):
🟢 Fractal ▲ - upper (Bearish) fractal.
🔴 Fractal ▼ — lower (Bullish) fractal.
⚪️ Fractal ▲/▼ - both upper and lower fractal.
↳ (H=high - L=low) = difference.
If you redirect notifications to a webhook URL, for example, to a Telegram bot, then you need to set the notification template for the webhook in the indicator settings in the "Webhook > Message" field (contains a tooltip with an example), in which you just need to specify the text {{message}}, which will be automatically replaced with the alert text with a ticker and a link to TradingView.
‼️ A signal is not a call to action, but only a reason to analyze the chart to make a decision based on the rules of your strategy.
***
Индикатор включает в себя Williams Alligator, Williams Fractals, Дивергентные бары, Market Facilitation Index, самый высокий и самый низкий бары, максимальный и минимальный пик Awesome Oscillator, а также оповещения о сигналах на основе стратегии Profitunity Билла Вильямса.
MFI и Awesome Oscillator
В соответствии с осциллятором Market Facilitation Index Приседающий бар окрашен в синий цвет, все остальные бары окрашены в соответствии с цветом Awesome Oscillator, кроме Фальшивых баров, которые окрашены более светлым цветом AO. В настройках индикатора вы можете включить отображение "Зеленых" баров (в поле "Green Bars > Show"). В настройках стиля индикатора вы можете выключить изменение цвета баров в соответствии с цветом AO (в поле "AO bars"), в том числе изменить цвет для Фальшивых баров (в поле "Fake AO bars").
MFI рассчитывается по формуле: (high - low) / volume.
Приседающий бар означает, что по сравнению с предыдущим баром его MFI снизился и в тоже время вырос его объем, т.е. MFI < предыдущего бара и объем > предыдущего бара. Признак возможного разворота цены, поэтому это особенно важный сигнал.
Фальшивый бар является противоположностью Приседающему бару и означает, что по сравнению с предыдущим баром его MFI увеличился и в тоже время снизился его объем, т.е. MFI > предыдущего бара и объем < предыдущего бара.
"Зеленый" бар означает, что по сравнению с предыдущим баром его MFI увеличился и в тоже время вырос его объем, т.е. MFI > предыдущего бара и объем > предыдущего бара. Признак продолжения тренда. Но более значимым подтверждением тренда или предупреждением о возможном развороте является Awesome Oscillator, который измеряет движущую силу рынка путем вычисления разницы между 5 Периодной и 34 Периодной Простыми Скользящими Средними (SMA 5 - SMA 34) по средним точкам баров (hl2). Поэтому по умолчанию "Зеленые" бары и противоположные им "Увядающие" бары окрашены в соответствии с цветом Awesome Oscillator.
По стратегии Profitunity Билла Вильямса с помощью осциллятора Awesome Oscillator определяется третья волна Эллиота по максимальному пику AO в интервале от 100 до 140 баров. Наличие дивергенции между максимальным пиком AO и следующим за ним более низким пиком AO в этом интервале также предупреждает о возможной коррекции, особенно если AO переходит через нулевую линию между этими пиками AO. Поэтому на графике дополнительно отображаются цены самого высокого и самого низкого баров, а также максимальный или минимальный пик АО в интервале 140 баров от последнего бара. В настройках индикатора вы можете скрыть метки, линии, изменить количество баров и любые параметры для индикатора AO – метод (SMA, Smoothed SMA, EMA и другие), длину, источник (open, high, low, close, hl2 и другие).
Бычий Дивергентный бар
🟢 Сигналом на покупку (Long) является Бычий Дивергентный бар над которым отображается зеленый круг, если такой бар соответствует одновременно всем следующим условиям:
Максимум бара ниже всех линий индикатора Alligator.
Цена закрытия бара выше его середины, т.е. close > (high + low) / 2.
Минимум бара ниже минимума 2-х предыдущих баров или ниже минимума одного предыдущего бара, а минимум второго предыдущего бара является нижним фракталом (▼). По умолчанию не отображаются Дивергентные бары, минимум которых ниже минимума только одного предыдущего бара и минимум 2-го предыдущего бара не является нижним фракталом (▼), но вы можете включить отображение любых Дивергентных баров в настройках индикатора (установив значение "no" в поле "Divergent Bars > Filtration").
Усилением сигнала Бычьего Дивергентного бара являются следующие условия:
Цена открытия бара, как и цена закрытия, выше его середины, т.е. Open > (high + low) / 2.
Максимум бара ниже всех линий открытого индикатора Alligator, т.е. зеленая линия (Lips) ниже красной линии (Teeth) и красная линия ниже синей линии (Jaw). В этом случае цвет круга над Бычьим Дивергентным баром окрашен в темно-зеленый цвет.
Приседающий Дивергентный бар.
Бар, следующий за Бычьим Дивергентным баром, соответствует зеленому цвету Awesome Oscillator.
Дивергенция на Awesome Oscillator.
Образование нижнего фрактала (▼), у которого минимум Дивергентного бара является пиком фрактала.
Медвежий Дивергентный бар
🔴 Сигналом на продажу (Short) является Медвежий Дивергентный бар под которым отображается красный круг, если такой бар соответствует одновременно всем следующим условиям:
Минимум бара выше всех линий индикатора Alligator.
Цена закрытия бара ниже его середины, т.е. close < (high + low) / 2.
Максимум бара выше маскимума 2-х предыдущих баров или выше максимума одного предыдущего бара, а максимум второго предыдущего бара является верхним фракталом (▲). По умолчанию не отображаются Дивергентные бары, максимум которых выше максимума только одного предыдущего бара и максимум 2-го предыдущего бара не является верхним фракталом (▲), но вы можете включить отображение любых Дивергентных баров в настройках индикатора (установив значение "no" в поле "Divergent Bars > Filtration").
Усилением сигнала Медвежьего Дивергентного бара являются следующие условия:
Цена открытия бара, как и цена закрытия, ниже его середины, т.е. open < (high + low) / 2.
Минимум бара выше всех линий открытого индикатора Alligator, т.е. зеленая линия (Lips) выше красной линии (Teeth) и красная линия выше синей линии (Jaw). В этом случае цвет круга под Медвежьим Дивергентным Баром окрашен в темно-красный цвет.
Приседающий Дивергентный бар.
Бар, следующий за Медвежьим Дивергентным баром, соответствует красному цвету Awesome Oscillator.
Дивергенция на Awesome Oscillator.
Образование верхнего фрактала (▲), у которого максимум Дивергентного бара является пиком фрактала.
Пересечение линий Alligator
Пересечение барами зеленой линии (Lips) открытого индикатора Alligator является первым предупреждением о возможной коррекции (откате цены) при выполнении одного из следующих условий:
Если бар закрылся ниже линии Lips, которая выше линии Teeth, а линия Teeth выше линии Jaw, при этом цена закрытия предыдущего бара находится выше линии Lips.
Если бар закрылся выше линии Lips, которая ниже линии Teeth, а линия Teeth ниже линии Jaw, при этом цена закрытия предыдущего бара находится ниже линии Lips.
Пересечение барами всех линий открытого Alligator является признаком глубокой коррекции и предупреждением о возможной смене тренда.
Частое пересечение линий Alligator между собой является признаком бокового тренда (флэт).
Оповещения о сигналах
Для получения уведомлений о сигналах при создании оповещения необходимо выбрать условие "При любом вызове функции alert()", в таком случае уведомления будут приходить в следующем формате:
D — таймфрейм, например: D, 4H, 15m.
🟢 BDB⎾ — сигнал Бычьего Дивергентного бара на покупку (Long), срабатывает один раз после закрытия бара и включает дополнительные сигналы:
/// — если Alligator открыт.
⏉ — если цена открытия бара, как и цена закрытия, выше его середины.
+ Squat 🔷 — Приседающий бар или + Green ↑ — "Зеленый" бар или + Fake ↓ — Фальшивый бар.
+ AO 🟩 — если после закрытия Дивергентного бара, изменение цвета осциллятора для следующего бара соответствует зеленому цвету Awesome Oscillator. ┴/┬ — AO выше/ниже нулевой линии. ∇ — если есть дивергенция на AO в интервале 140 баров от последнего бара.
🔴 BDB⎿ — сигнал Медвежьего Дивергентного бара на продажу (Short), срабатывает один раз после закрытия бара и включает дополнительные сигналы:
/// — если Alligator открыт.
⏊ — если цена открытия бара, как и цена закрытия, ниже его середины.
+ Squat 🔷 — Приседающий бар или + Green ↑ — "Зеленый" бар или + Fake ↓ — Фальшивый бар.
+ AO 🟥 — если после закрытия Дивергентного бара, изменение цвета осциллятора для следующего бара соответствует красному цвету Awesome Oscillator. ┴/┬ — AO выше/ниже нулевой линии. ∇ — если есть дивергенция на AO в интервале 140 баров от последнего бара.
Сигнал пересечения барами зеленой линии (Lips) открытого индикатора Alligator (можно отключить в настройках индикатора в поле "Alligator > Enable crossing lips alerts"):
🔴 Crossing Lips ↓ — если бар закрылся ниже линии Lips, которая выше остальных линий, при этом цена закрытия предыдущего бара находится выше линии Lips.
🟢 Crossing Lips ↑ — если бар закрылся выше линии Lips, которая ниже остальных линий, при этом цена закрытия предыдущего бара находится ниже линии Lips.
Сигнал фрактала срабатывает после закрытия второго бара, завершающего формирование фрактала, если оповещения о фракталах включены в настройках индикатора (поле "Fractals > Enable alerts"):
🟢 Fractal ▲ — верхний (Медвежий) фрактал.
🔴 Fractal ▼ — нижний (Бычий) фрактал.
⚪️ Fractal ▲/▼ — одновременно верхний и нижний фрактал.
↳ (H=high - L=low) = разница.
Если вы перенаправляете оповещения на URL вебхука, например, в бота Telegram, то вам необходимо установить шаблон оповещения для вебхука в настройках индикатора в поле "Webhook > Message" (содержит подсказку с примером), в котором в качестве текста сообщения достаточно указать текст {{message}}, который будет автоматически заменен на текст оповещения с тикером и ссылкой на TradingView.
‼️ Сигнал — это не призыв к действию, а лишь повод проанализировать график для принятия решения на основе правил вашей стратегии.

QQE MOD + SSL Hybrid + Waddah Attar Explosion IndicatorINDICATOR PURPOSE
This indicator is designed to complement my original QQE MOD + SSL Hybrid + Waddah Attar Explosion strategy.
Multiple users have requested that I convert the strategy to an indicator because alertconditions do not work on strategies and people want to specific set alerts for BUY, SELL, CLOSE BUY and CLOSE SELL. This can only be achieved using alertcondition().
This indicator functions in the exact same way as the strategy, but it doesn't have any backtesting functionality. I recomment that you use the original QQE MOD + SSL Hybrid + Waddah Attar Explosion strategy for parameter tuning and backtesting, then if you need more control on alerts you can use this indicator for that purpose.
Only other difference is that I have added grey exit labels on the chart since it's not obvious where the exits would happen like it was in the strategy version.
CREDITS
QQE MOD byMihkel00
SSL Hybrid by Mihkel00
Waddah Attar Explosion by shayankm

Overbought / Oversold Screener## Introduction
**The Versatile RSI and Stochastic Multi-Symbol Screener**
**Unlock a wealth of trading opportunities with this customizable screener, designed to pinpoint potential overbought and oversold conditions across 17 symbols, with alert support!**
## Description
This screener is suitable for tracking multiple instruments continuously.
With the screener, you can see the instant RSI or Stochastic values of the instruments you are tracking, and easily catch the moments when they are overbought / oversold according to your settings.
The purpose of the screener is to facilitate the continuous tracking of multiple instruments. The user can track up to 17 different instruments in different time intervals. If they wish, they can set an alarm and learn overbought oversold according to the values they set for the time interval of the instruments they are tracking.**
Key Features:
Comprehensive Analysis:
Monitors RSI and Stochastic values for 17 symbols simultaneously.
Automatically includes the current chart's symbol for seamless integration.
Supports multiple timeframes to uncover trends across different time horizons.
Personalized Insights:
Adjust overbought and oversold thresholds to align with your trading strategy.
Sort results by symbol, RSI, or Stochastic values to prioritize your analysis.
Choose between Automatic, Dark, or Light mode for optimal viewing comfort.
Dynamic Visual Cues:
Instantly highlights oversold and overbought symbols based on threshold levels.
Timely Alerts:
Stay informed of potential trading opportunities with alerts for multiple oversold or overbought symbols.
## Settings
### Display
**Timeframe**
The screener displays the values according to the selected timeframe. The default timeframe is "Chart". For example, if the timeframe is set to "15m" here, the screener will show the RSI and stochastic values for the 15-minute chart.
** Theme **
This setting is for changing the theme of the screener. You can set the theme to "Automatic", "Dark", or "Light", with "Automatic" being the default value. When the "Automatic" theme is selected, the screener appearance will also be automatically updated when you enable or disable dark mode from the TradingView settings.
** Position **
This option is for setting the position of the table on the chart. The default setting is "middle right". The available options are (top, middle, bottom)-(left, center, right).
** Sort By **
This option is for changing the sorting order of the table. The default setting is "RSI Descending". The available options are (Symbol, RSI, Stoch)-(Ascending, Descending).
It is important to note that the overbought and oversold coloring of the symbols may also change when the sorting order is changed. If RSI is selected as the sorting order, the symbols will be colored according to the overbought and oversold threshold values specified for RSI. Similarly, if Stoch is selected as the sorting order, the symbols will be colored according to the overbought and oversold threshold values specified for Stoch.
From this perspective, you can also think of the sorting order as a change in the main indicator.
### RSI / Stochastic
This area is for selecting the parameters of the RSI and stochastic indicators. You can adjust the values for "length", "overbought", and "oversold" for both indicators according to your needs. The screener will perform all RSI and stochastic calculations according to these settings. All coloring in the table will also be according to the overbought and oversold values in these settings.
### Symbols
The symbols to be tracked in the table are selected from here. Up to 16 symbols can be selected from here. Since the symbol in the chart is automatically added to the table, there will always be at least 1 symbol in the table. Note that the symbol in the chart is shown in the table with "(C)". For example, if SPX is open in the chart, it is shown as SPX(C) in the table.
## Alerts
The screener is capable of notifying you with an alarm if multiple symbols are overbought or oversold according to the values you specify along with the desired timeframe. This way, you can instantly learn if multiple symbols are overbought or oversold with one alarm, saving you time.

DiscordWebhooksLibrary🚀 Introduction
Welcome to the TradingView PineScript Library for Discord Webhook Integration! This library is designed for traders and developers who use TradingView for technical analysis and want to integrate their trading strategies with Discord notifications.
Key Features:
* Embed Creation: Easily create rich and informative embeds for your Discord messages, allowing you to send detailed trading alerts and summaries.
* Flexible Webhook Formatting: Customize your Discord messages with options for usernames, avatars, and text content, providing a personalized touch to your notifications.
* Simple Integration: Designed with simplicity in mind, this library can be integrated into your existing Pine Script trading strategies without extensive coding knowledge.
* Real-time Alerts: Utilize TradingView's alert system to send real-time trade signals and market updates to your Discord server.
Compatibility:
This library is compatible with TradingView's Pine Script version 5.
🍃 Code Snippets and Usage Examples
The following examples demonstrate how to use the Discord Webhook Integration Library in your TradingView Pine Scripts. These snippets cover various scenarios, showcasing the flexibility and utility of the library.
Example 1: Simple Alert with Markdown in Embed Description
embedDesc = "This is a **bold** and _italic_ alert message with a (replace_with_your_link)"
embedJson = createEmbedJSON("Simple Alert", embedDesc, 12345)
content = discordWebhookJSON("Alert from Captain Hook", "Captain Hook", na, embedJson)
Example 2: Multiple Embeds with Different Markdown Styles
embedDesc1 = "First alert with **bold** text"
embedDesc2 = "Second alert with _italic_ text"
embedDesc3 = "Third alert with ~~strikethrough~~"
embedJson1 = createEmbedJSON("Alert 1", embedDesc1, 654321)
embedJson2 = createEmbedJSON("Alert 2", embedDesc2, 123456)
embedJson3 = createEmbedJSON("Alert 3", embedDesc3, 111111)
embeds = embedJson1 + "," + embedJson2 + "," + embedJson3
content = discordWebhookJSON("Multiple Alerts", "Captain Hook", na, embeds)
Example 3: Complex Alert with Full Markdown Usage in Embed
embedDesc = "Alert: **Price Breakout!** " +
"*Symbol*: " + syminfo.ticker + " " +
"*Price*: $" + str.tostring(close) + " " +
" (replace_with_your_link)"
embedJson = createEmbedJSON("Complex Alert", embedDesc, 16711680) // Red color
content = discordWebhookJSON("Complex Alert", "Captain Hook", na, embedJson)
Example 4: Advanced Technical Analysis Alert
rsiValue = ta.rsi(close, 14)
= ta.macd(close, 12, 26, 9)
taMessage = "RSI: " + str.tostring(rsiValue) + " MACD: " + str.tostring(macdLine)
embedJson = createEmbedJSON("Technical Analysis Update", taMessage, 255) // Blue color
content = discordWebhookJSON("TA Alert", "Captain Hook", na, embedJson)
Example 5: Market Summary with Multiple Fields
counterTrend = "Your counter trend criterias"
counterTrendEmbed = createEmbedJSON(title = "Counter Trend", description = counterTrend, color = 15258703)
redFlags = "Your red flag criterias"
redFlagsEmbed = createEmbedJSON(title = "Red Flags", description = redFlags, color = 15229263)
embeds = counterTrendEmbed + "," + redFlagsEmbed
content = discordWebhookJSON(contentText = "Example of how a market analysis could look like", username = "Captain Hook", embeds = embeds)
🚨 Error Handling
Use Escape Characters Correctly: In message strings, remember to use for new lines instead of . This ensures that the newline character is correctly interpreted in the JSON format.
It can be helpful to plot the json on the last candle
if barstate.islast
label.new(bar_index, high, text=debugMessage, color=color.red, textcolor=color.white, yloc=yloc.abovebar)
🔥 FAQs
Q1: Can I send alerts for multiple conditions?
A: Yes, you can configure multiple conditions in your script. Use separate if statements for each condition and call the discordWebhookJSON function with the relevant message for each alert.
Q2: Why is my alert not triggering?
A: Ensure your alert conditions are correct and that you've properly set up the webhook in both your script and TradingView's alert configuration. Also, check for any syntax errors in your script.
Q3: How many alerts can I send to Discord?
A: While TradingView doesn't limit the number of alerts, Discord has rate limits for webhooks. Be mindful of these limits to avoid your webhook being temporarily blocked.
Q4: Can I customize the appearance of my Discord messages?
A: Yes, the createEmbedJSON function allows you to customize your messages with titles, descriptions, colors, and more. Experiment with different parameters to achieve the desired appearance.
Q5: Is it possible to include real-time data in alerts?
A: Yes, your script can include real-time price data, indicator values, or any other real-time data available in Pine Script.
Q6: How can I contribute to the library or suggest improvements?
A: You can provide feedback, suggest improvements, or contribute to the library's development through the community channels or contact points provided in the "Support and Community" section.
formatTimeframe()
discordWebhookJSON(contentText, username, avatar_url, embeds)
Constructs a JSON string for a Discord webhook message. This string includes optional fields for content, username, avatar URL, and embeds.
Parameters:
contentText (string) : (string, optional): The main text content of the webhook message. Default is 'na'.
username (string) : (string, optional): Overrides the default username of the webhook. Default is 'na'.
avatar_url (string) : (string, optional): Overrides the default avatar URL of the webhook. Default is 'na'.
embeds (string) : (string, optional): A string containing one or more embed JSON objects. This should be formatted correctly as a JSON array. Default is 'na'.
createEmbedJSON(title, description, color, authorName, authorUrl, authorIconUrl, fields)
Creates a JSON string for a single embed object for a Discord webhook.
Parameters:
title (string) : (string, optional): The title of the embed. Default is 'na' (not applicable).
description (string) : (string, optional): The description text of the embed. Supports basic formatting. Default is 'na'.
color (int) : (int, optional): The color code of the embed, typically in decimal format. Default is 'na'.
authorName (string) : (string, optional): The name of the author to display in the embed. Default is 'na'.
authorUrl (string) : (string, optional): The URL linked to the author's name. Default is 'na'.
authorIconUrl (string) : (string, optional): The URL of the icon to display next to the author's name. Default is 'na'.
fields (string) : (string, optional): A string containing one or more field JSON objects. This should be formatted correctly as a JSON array. Default is 'na'. Note: Use the 'createEmbedFieldJSON' function to generate these JSON field strings before adding them to the array.
createEmbedFieldJSON(name, value, inline)
Creates a JSON string representing a single field object within an embed for a Discord webhook message.
Parameters:
name (string) : (string): The name of the field, acting as a title for the field content.
value (string) : (string): The value of the field, containing the actual text or information you want to display within the field.
inline (bool) : (bool, optional): A boolean flag indicating whether the field should be displayed inline with other fields. If set to true, the field will be displayed on the same line as the next field
❤️ Please, support the work with like & comment! ❤️

REMA CROSSOVER BY JUGNUThis indicator triggers alerts for long and short positions on DAILY TIME FRAME for SWING trades based on the conditions which described below. This script will generate alerts when the following conditions are met:
LONG POSITION:
RSI(14) above 50.
EMA(5) crosses above EMA(10).
Indicator Triangle Green below price bars
SHORT POSITION:
RSI(14) below 50.
EMA(5) crosses down EMA(10).
Indicator Triangle RED above price bars
This script plots green and red triangles below and above the price bars to indicate long and short alert conditions, respectively. It also triggers alerts when these conditions are met.
Crypto Spot/Futures Dominance Indicator with AlertsFutures/Spot Dominance Indicator:
Overview:
The futures/spot dominance indicator is a versatile tool used by traders and analysts to assess the relative strength or dominance of the futures market in relation to the spot (or cash) market for a specific asset. It offers insights into market sentiment, potential arbitrage opportunities, and risk management while incorporating the VWAP indicator for added context.
How It Works:
This indicator automatically detects and adapts to the futures symbol applied to the chart, simplifying the setup for traders. However, it still necessitates manual input of the corresponding spot pair to ensure accuracy.
Automatic Futures Symbol Detection: The indicator starts by automatically detecting the futures symbol on the trading chart, eliminating the need for manual configuration. This ensures that the indicator is applied to the correct futures contract.
Manual Spot Pair Entry: To provide a reliable reference point for the comparison, traders must manually input the corresponding spot symbol via the indicator's inputs. For instance, if the indicator detects the BTCUSDT.P futures symbol, traders would manually enter the BTCUSDT spot symbol.
Gathering Data: The indicator collects historical price data for both the detected futures contract and the manually specified spot symbol. This data includes open, high, low, and close prices, as well as trading volume.
VWAP Calculation: To gain a deeper understanding of price trends and market dynamics, the indicator calculates the VWAP (Volume Weighted Average Price) for both the futures and spot markets. The VWAP places more weight on prices with higher trading volume, offering a weighted average that reflects market consensus.
Premium/Discount Calculation: By subtracting the VWAP of the spot market from the VWAP of the futures market, the indicator quantifies the premium or discount of the futures price concerning the spot price. A positive value indicates a premium, while a negative value suggests a discount.
Plotting: The premium/discount value is displayed as a line on the chart, often alongside moving averages or other smoothing techniques for improved trend analysis.
Alerts: In addition to its analysis capabilities, this indicator now includes alerts to enhance your trading experience. It alerts you in the following scenarios:
Premium Above Average: Notifies you when the premium crosses above the average line.
Premium Below Average: Alerts you when the premium crosses below the average line.
Premium Above Zero: Provides an alert when the premium crosses above the zero line.
Premium Below Zero: Generates an alert when the premium crosses below the zero line.
Benefits of the Futures/Spot Dominance Indicator:
Sentiment Analysis: Traders use the indicator to assess market sentiment. A futures premium might signify bullish sentiment, while a discount could indicate bearish sentiment.
Arbitrage Opportunities: Identifying price discrepancies between futures and spot markets can help traders spot arbitrage opportunities, where they can profit from price differentials.
Risk Management: The indicator assists in evaluating risks associated with futures positions, helping traders manage their exposure effectively.
Trend Confirmation: When used in conjunction with other technical indicators, futures/spot dominance, along with VWAP, can provide additional confirmation of price trends.
Hedging: Investors and corporations use this tool to gauge the effectiveness of hedging strategies based on futures contracts.
Speculative Trading: Traders and investors use the indicator to inform speculative positions, aligning their trades with perceived market strength or weakness.
Insightful Analysis: Futures/spot dominance analysis, enriched by VWAP data, offers insights into market behavior during specific events or changes in economic conditions.
In summary, the futures/spot dominance indicator, with its integration of VWAP and automatic futures symbol detection, provides traders and investors with a comprehensive tool to assess market dynamics. It aids in sentiment analysis, risk management, and trend confirmation while offering potential arbitrage opportunities. The newly added alerts enhance the indicator's functionality, providing timely notifications of key market events. However, it relies on manual input of the corresponding spot pair to ensure precise comparisons between futures and spot markets. It should be used alongside other analysis techniques for a well-rounded view of the market.

BDL Range AlertAs soon as you call this indicator, it asks you to define the range. Select the bottom and the top of the range. Next, set your alarm. There are 3 alarm options:
1: Bottom of the range breakout
2: Top of the range breakout
3: Bottom or top of the range breakout
As soon as you close a candle outside the selected range, only then will the alarm be triggered.
Antares_messages_publicLibrary "Antares_messages_public"
This library add messages for yours strategy for use in Antares trading system for binance and bybit exchanges.
Данная библиотека позволяет формировать сообщения в алертах стратегий для Antares в более упрощенном для пользователя режиме, включая всплывающие подсказки и т.д.
set_leverage(token, market, ticker_id, leverage)
Set leverage for ticker on specified market.
Parameters:
token (string) : (integer or 0) token for trade in system, if = 0 then token part mess is empty. Токен, При значениb = 0 не включается в формирование строки алерта.
market (string) : (string) Spot 'binance' , 'bybit' . Futures ('binancefru','binancefro','bybitfu', 'bybitfi'). Строковая переменная названия биржи.
ticker_id (string) : (string) ticker in market ('btcusdt', 'ethusdt' etc...). Строковая переменная названия тикера (пары).
leverage (float) : (float) leverage level. Устанавливаемое плечо.
Returns: 'Set leverage message'.
pause(time_pause)
Set pause in message. '::' -left and '::' -right included.
Parameters:
time_pause (int)
LongLimit(token, market, ticker_id, type_qty, quantity, price, orderId, leverageforqty)
Buy order with limit price and quantity.
Лимитный ордер на покупку(в лонг).
Parameters:
token (string) : (integer or 0) token for trade in system, if = 0 then token part mess is empty. Токен, При значениb = 0 не включается в формирование строки алерта.
market (string) : (string) Spot 'binance' , 'bybit' . Futures ('binancefru','binancefro','bybitfu', 'bybitfi'). Строковая переменная названия биржи.
ticker_id (string) : (string) ticker in market ('btcusdt', 'ethusdt' etc...). Строковая переменная названия тикера (пары).
type_qty (string) : (string) type of quantity: 1. 'qty' or '' or na - standart (in coins), 2. 'quqty'- in assets (usdt,btc,etc..), 3.open% - open position(futures) or buy (spot) in % of base 4. close% - close in % of position (futures) or sell (spot) coins in % for current quantity
quantity (float) : (float) orders size, see at 'type_qty'. Размер ордера, базы или % в соответствии с 'type_qty'
price (float) : (float) price for limit order. Цена по которой должен быть установлен лимитный ордер.
orderId (string) : (string) if use order id you may change or cancel your order after or set it ''. Используйте OrderId если хотите изменить или отменить ордер в будущем.
leverageforqty (bool) : (bool) use leverage in qty. Использовать плечо при расчете количества или нет.
Returns: 'Limit Buy order'. Лимитный ордер на покупку (лонг).
LongMarket(token, market, ticker_id, type_qty, quantity, leverageforqty)
Market Buy order with quantity.
Рыночный ордер на покупку (в лонг).
Parameters:
token (string) : (integer or 0) token for trade in system, if = 0 then token part mess is empty. Токен, При значениb = 0 не включается в формирование строки алерта.
market (string) : (string) Spot 'binance' , 'bybit' . Futures ('binancefru','binancefro','bybitfu', 'bybitfi'). Строковая переменная названия биржи.
ticker_id (string) : (string) ticker in market ('btcusdt', 'ethusdt' etc...). Строковая переменная названия тикера (пары).
type_qty (string) : (string) type of quantity: 1. 'qty' or '' or na - standart (in coins), 2. 'quqty'- in assets (usdt,btc,etc..), 3.open% - open position(futures) or buy (spot) in % of base 4. close% - close in % of position (futures) or sell (spot) coins in % for current quantity
quantity (float) : (float) orders size, see at 'type_qty'. Размер ордера, базы или % в соответствии с 'type_qty'
leverageforqty (int) : (bool) use leverage in qty. Использовать плечо при расчете количества или нет.
Returns: 'Market Buy order'. Маркетный ордер на покупку (лонг).
ShortLimit(token, market, ticker_id, type_qty, quantity, price, leverageforqty, orderId)
Sell order with limit price and quantity.
Лимитный ордер на продажу(в шорт).
Parameters:
token (string) : (integer or 0) token for trade in system, if = 0 then token part mess is empty. Токен, При значениb = 0 не включается в формирование строки алерта.
market (string) : (string) Spot 'binance' , 'bybit' . Futures ('binancefru','binancefro','bybitfu', 'bybitfi'). Строковая переменная названия биржи.
ticker_id (string) : (string) ticker in market ('btcusdt', 'ethusdt' etc...). Строковая переменная названия тикера (пары).
type_qty (string) : (string) type of quantity: 1. 'qty' or '' or na - standart (in coins), 2. 'quqty'- in assets (usdt,btc,etc..), 3.open% - open position(futures) or buy (spot) in % of base 4. close% - close in % of position (futures) or sell (spot) coins in % for current quantity
quantity (float) : (float) orders size, see at 'type_qty'. Размер ордера, базы или % в соответствии с 'type_qty'
price (float) : (float) price for limit order. Цена по которой должен быть установлен лимитный ордер.
leverageforqty (bool) : (bool) use leverage in qty. Использовать плечо при расчете количества или нет.
orderId (string) : (string) if use order id you may change or cancel your order after or set it ''. Используйте OrderId если хотите изменить или отменить ордер в будущем.
Returns: 'Limit Sell order'. Лимитный ордер на продажу (шорт).
ShortMarket(token, market, ticker_id, type_qty, quantity, leverageforqty)
Sell by market price and quantity.
Рыночный ордер на продажу(в шорт).
Parameters:
token (string) : (integer or 0) token for trade in system, if = 0 then token part mess is empty. Токен, При значениb = 0 не включается в формирование строки алерта.
market (string) : (string) Spot 'binance' , 'bybit' . Futures ('binancefru','binancefro','bybitfu', 'bybitfi'). Строковая переменная названия биржи.
ticker_id (string) : (string) ticker in market ('btcusdt', 'ethusdt' etc...). Строковая переменная названия тикера (пары).
type_qty (string) : (string) type of quantity: 1. 'qty' or '' or na - standart (in coins), 2. 'quqty'- in assets (usdt,btc,etc..), 3.open% - open position(futures) or buy (spot) in % of base 4. close% - close in % of position (futures) or sell (spot) coins in % for current quantity
quantity (float) : (float) orders size, see at 'type_qty'. Размер ордера, базы или % в соответствии с 'type_qty'
leverageforqty (int) : (bool) use leverage in qty. Использовать плечо при расчете количества или нет.
Returns: 'Market Sell order'. Маркетный ордер на продажу (шорт).
Cancel_by_ticker(token, market, ticker_id)
Cancel all orders for market and ticker in setups. Отменяет все ордера на заданной бирже и заданном токене(паре).
Parameters:
token (string)
market (string) : (string) Spot 'binance' , 'bybit' . Futures ('binancefru','binancefro','bybitfu', 'bybitfi'). Строковая переменная названия биржи.
ticker_id (string) : (string) ticker in market ('btcusdt', 'ethusdt' etc...). Строковая переменная названия тикера (пары).
Returns: 'Cancel all orders'. Отмена всех ордеров на заданной бирже и заданном токене(паре).
Cancel_by_id(token, market, ticker_id, orderId)
Cancel order by Id for market and ticker in setups. Отменяет ордер по Id на заданной бирже и заданном токене(паре).
Parameters:
token (string)
market (string) : (string) Spot 'binance' , 'bybit' . Futures ('binancefru','binancefro','bybitfu', 'bybitfi'). Строковая переменная названия биржи.
ticker_id (string) : (string) ticker in market ('btcusdt', 'ethusdt' etc...). Строковая переменная названия тикера (пары).
orderId (string)
Returns: 'Cancel order'. Отмена ордера по Id на заданной бирже и заданном токене(паре).
Close_positions(token, market, ticker_id)
Close all positions for market and ticker in setups. Закрывает все позиции на заданной бирже и заданном токене(паре).
Parameters:
token (string)
market (string) : (string) Spot 'binance' , 'bybit' . Futures ('binancefru','binancefro','bybitfu', 'bybitfi'). Строковая переменная названия биржи.
ticker_id (string) : (string) ticker in market ('btcusdt', 'ethusdt' etc...). Строковая переменная названия тикера (пары).
Returns: 'Close positions'
CloseLongLimit(token, market, ticker_id, type_qty, quantity, price, orderId, leverageforqty)
Close limit order for long position. (futures)
Лимитный ордер на продажу(в шорт) для закрытия лонговой позиции(reduceonly).
Parameters:
token (string) : (integer or 0) token for trade in system, if = 0 then token part mess is empty. Токен, При значениb = 0 не включается в формирование строки алерта.
market (string) : (string) Spot 'binance' , 'bybit' . Futures ('binancefru','binancefro','bybitfu', 'bybitfi'). Строковая переменная названия биржи.
ticker_id (string) : (string) ticker in market ('btcusdt', 'ethusdt' etc...). Строковая переменная названия тикера (пары).
type_qty (string) : (string) type of quantity: 1. 'qty' or '' or na - standart (in coins), 2. 'quqty'- in assets (usdt,btc,etc..), 3.open% - open position(futures) or buy (spot) in % of base 4. close% - close in % of position (futures) or sell (spot) coins in % for current quantity
quantity (float) : (float) orders size, see at 'type_qty'. Размер ордера, базы или % в соответствии с 'type_qty'
price (float) : (float) price for limit order. Цена по которой должен быть установлен лимитный ордер.
orderId (string) : (string) if use order id you may change or cancel your order after or set it ''. Используйте OrderId если хотите изменить или отменить ордер в будущем.
leverageforqty (bool) : (bool) use leverage in qty. Использовать плечо при расчете количества или нет.
Returns: 'Limit Sell order reduce only (close long position)'. Лимитный ордер на продажу для снижения текущего лонга(в шорт не входит).
CloseLongMarket(token, market, ticker_id, type_qty, quantity, leverageforqty)
Close market order for long position.
Рыночный ордер на продажу(в шорт) для закрытия лонговой позиции(reduceonly).
Parameters:
token (string) : (integer or 0) token for trade in system, if = 0 then token part mess is empty. Токен, При значениb = 0 не включается в формирование строки алерта.
market (string) : (string) Spot 'binance' , 'bybit' . Futures ('binancefru','binancefro','bybitfu', 'bybitfi'). Строковая переменная названия биржи.
ticker_id (string) : (string) ticker in market ('btcusdt', 'ethusdt' etc...). Строковая переменная названия тикера (пары).
type_qty (string) : (string) type of quantity: 1. 'qty' or '' or na - standart (in coins), 2. 'quqty'- in assets (usdt,btc,etc..), 3.open% - open position(futures) or buy (spot) in % of base 4. close% - close in % of position (futures) or sell (spot) coins in % for current quantity
quantity (float) : (float) orders size, see at 'type_qty'. Размер ордера, базы или % в соответствии с 'type_qty'
leverageforqty (bool) : (bool) use leverage in qty. Использовать плечо при расчете количества или нет.
Returns: 'Market Sell order reduce only (close long position)'. Ордер на снижение/закрытие текущего лонга(в шорт не входит) по рыночной цене.
CloseShortLimit(token, market, ticker_id, type_qty, quantity, price, orderId, leverageforqty)
Close limit order for short position.
Лимитный ордер на покупку(в лонг) для закрытия шортовой позиции(reduceonly).
Parameters:
token (string) : (integer or 0) token for trade in system, if = 0 then token part mess is empty. Токен, При значениb = 0 не включается в формирование строки алерта.
market (string) : (string) Spot 'binance' , 'bybit' . Futures ('binancefru','binancefro','bybitfu', 'bybitfi'). Строковая переменная названия биржи.
ticker_id (string) : (string) ticker in market ('btcusdt', 'ethusdt' etc...). Строковая переменная названия тикера (пары).
type_qty (string) : (string) type of quantity: 1. 'qty' or '' or na - standart (in coins), 2. 'quqty'- in assets (usdt,btc,etc..), 3.open% - open position(futures) or buy (spot) in % of base 4. close% - close in % of position (futures) or sell (spot) coins in % for current quantity
quantity (float) : (float) orders size, see at 'type_qty'. Размер ордера, базы или % в соответствии с 'type_qty'
price (float) : (float) price for limit order. Цена по которой должен быть установлен лимитный ордер.
orderId (string) : (string) if use order id you may change or cancel your order after or set it ''. Используйте OrderId если хотите изменить или отменить ордер в будущем.
leverageforqty (bool) : (bool) use leverage in qty. Использовать плечо при расчете количества или нет.
Returns: 'Limit Buy order reduce only (close short position)' . Лимитный ордер на покупку (лонг) для сокращения/закрытия текущего шорта.
CloseShortMarket(token, market, ticker_id, type_qty, quantity, leverageforqty)
Set Close limit order for long position.
Рыночный ордер на покупку(в лонг) для сокращения/закрытия шортовой позиции(reduceonly).
Parameters:
token (string) : (integer or 0) token for trade in system, if = 0 then token part mess is empty. Токен, При значениb = 0 не включается в формирование строки алерта.
market (string) : (string) Spot 'binance' , 'bybit' . Futures ('binancefru','binancefro','bybitfu', 'bybitfi'). Строковая переменная названия биржи.
ticker_id (string) : (string) ticker in market ('btcusdt', 'ethusdt' etc...). Строковая переменная названия тикера (пары).
type_qty (string) : (string) type of quantity: 1. 'qty' or '' or na - standart (in coins), 2. 'quqty'- in assets (usdt,btc,etc..), 3.open% - open position(futures) or buy (spot) in % of base 4. close% - close in % of position (futures) or sell (spot) coins in % for current quantity
quantity (float) : (float) orders size, see at 'type_qty'. Размер ордера, базы или % в соответствии с 'type_qty'
leverageforqty (bool) : (bool) use leverage in qty. Использовать плечо при расчете количества или нет.
Returns: 'Market Buy order reduce only (close short position)'. Маркетного ордера на покупку (лонг) для сокращения/закрытия текущего шорта.
cancel_all_close(token, market, ticker_id)
Parameters:
token (string)
market (string)
ticker_id (string)
limit_tpsl_bybitfu(token, ticker_id, order_id, side, type_qty, quantity, price, tp_price, sl_price, leverageforqty)
Set multi order for Bybit : limit + takeprofit + stoploss
Выставление тройного ордера на Bybit лимитка со стоплоссом и тейкпрофитом
Parameters:
token (string) : (integer or 0) token for trade in system, if = 0 then token part mess is empty. Токен, При значениb = 0 не включается в формирование строки алерта.
ticker_id (string) : (string) ticker in market ('btcusdt', 'ethusdt' etc...). Строковая переменная названия тикера (пары).
order_id (string)
side (bool) : (bool) "buy side" if true or "sell side" if false. true для лонга, false для шорта.
type_qty (string) : (string) type of quantity: 1. 'qty' or '' or na - standart (in coins), 2. 'quqty'- in assets (usdt,btc,etc..), 3.open% - open position(futures) or buy (spot) in % of base 4. close% - close in % of position (futures) or sell (spot) coins in % for current quantity
quantity (float) : (float) orders size, see at 'type_qty'. Размер ордера, базы или % в соответствии с 'type_qty'
price (float) : (float) price for limit order by 'side'. Цена лимитного ордера
tp_price (float) : (float) price for take profit order.
sl_price (float) : (float) price for stoploss order
leverageforqty (bool) : (bool) use leverage in qty. Использовать плечо при расчете количества или нет.
Returns: Set multi order for Bybit : limit + takeprofit + stoploss.
replace_limit_tpsl_bybitfu(token, ticker_id, order_id, side, type_qty, quantity, price, tp_price, sl_price, leverageforqty)
Change multi order for Bybit : limit + takeprofit + stoploss
Изменение тройного ордера на Bybit лимитка со стоплоссом и тейкпрофитом
Parameters:
token (string) : (integer or 0) token for trade in system, if = 0 then token part mess is empty. Токен, При значениb = 0 не включается в формирование строки алерта.
ticker_id (string) : (string) ticker in market ('btcusdt', 'ethusdt' etc...). Строковая переменная названия тикера (пары).
order_id (string)
side (bool) : (bool) "buy side" if true or "sell side" if false. true для лонга, false для шорта.
type_qty (string) : (string) type of quantity: 1. 'qty' or '' or na - standart (in coins), 2. 'quqty'- in assets (usdt,btc,etc..), 3.open% - open position(futures) or buy (spot) in % of base 4. close% - close in % of position (futures) or sell (spot) coins in % for current quantity
quantity (float) : (float) orders size, see at 'type_qty'. Размер ордера, базы или % в соответствии с 'type_qty'
price (float) : (float) price for limit order by 'side'. Цена лимитного ордера
tp_price (float) : (float) price for take profit order.
sl_price (float) : (float) price for stoploss order
leverageforqty (bool) : (bool) use leverage in qty. Использовать плечо при расчете количества или нет.
Returns: Set multi order for Bybit : limit + takeprofit + stoploss.
long_stop(token, market, ticker_id, type_qty, quantity, l_stop, leverageforqty)
Stop market order for long position
Рыночный стоп-ордер на продажу для закрытия лонговой позиции.
Parameters:
token (string)
market (string) : (string) 'binance' , 'binancefru' etc.. Строковая переменная названия биржи.
ticker_id (string) : (string) ticker in market ('btcusdt', 'ethusdt' etc...). Строковая переменная названия тикера (пары).
type_qty (string) : (string) type of quantity: 1. 'qty' or '' or na - standart (in coins), 2. 'quqty'- in assets (usdt,btc,etc..), 3.open% - open position(futures) or buy (spot) in % of base 4. close% - close in % of position (futures) or sell (spot) coins in % for current quantity
quantity (float) : (float) orders size. Размер ордера.
l_stop (float) : (float) price for activation stop order. Цена активации стоп-ордера.
leverageforqty (bool) : (bool) use leverage in qty. Использовать плечо при расчете количества или нет.
Returns: 'Stop Market Sell order (close long position)'. Маркетный стоп-ордер на снижения/закрытия текущего лонга.
short_stop(token, market, ticker_id, type_qty, quantity, s_stop, leverageforqty)
Stop market order for short position
Рыночный стоп-ордер на покупку(в лонг) для закрытия шорт позиции.
Parameters:
token (string)
market (string) : (string) 'binance' , 'binancefru' etc.. Строковая переменная названия биржи.
ticker_id (string) : (string) ticker in market ('btcusdt', 'ethusdt' etc...). Строковая переменная названия тикера (пары).
type_qty (string) : (string) type of quantity: 1. 'qty' or '' or na - standart (in coins), 2. 'quqty'- in assets (usdt,btc,etc..), 3.open% - open position(futures) or buy (spot) in % of base 4. close% - close in % of position (futures) or sell (spot) coins in % for current quantity
quantity (float) : (float) orders size. Размер ордера.
s_stop (float) : (float) price for activation stop order. Цена активации стоп-ордера.
leverageforqty (bool) : (bool) use leverage in qty. Использовать плечо при расчете количества или нет.
Returns: 'Stop Market Buy order (close short position)'. Маркетный стоп-ордер на снижения/закрытия текущего шорта.
change_stop_l(token, market, ticker_id, type_qty, quantity, l_stop, leverageforqty)
Change Stop market order for long position
Изменяем стоп-ордер на продажу(в шорт) для закрытия лонг позиции.
Parameters:
token (string)
market (string) : (string) 'binance' , 'binancefru' etc.. Строковая переменная названия биржи.
ticker_id (string) : (string) ticker in market ('btcusdt', 'ethusdt' etc...). Строковая переменная названия тикера (пары).
type_qty (string) : (string) type of quantity: 1. 'qty' or '' or na - standart (in coins), 2. 'quqty'- in assets (usdt,btc,etc..), 3.open% - open position(futures) or buy (spot) in % of base 4. close% - close in % of position (futures) or sell (spot) coins in % for current quantity
quantity (float) : (float) orders size. Размер ордера.
l_stop (float) : (float) price for activation stop order. Цена активации стоп-ордера.
leverageforqty (bool) : (bool) use leverage in qty. Использовать плечо при расчете количества или нет.
Returns: 'Change Stop Market Buy order (close long position)'. Смещает цену активации Маркетного стоп-ордер на снижения/закрытия текущего лонга.
change_stop_s(token, market, ticker_id, type_qty, quantity, s_stop, leverageforqty)
Change Stop market order for short position
Смещает цену активации Рыночного стоп-ордера на покупку(в лонг) для закрытия шорт позиции.
Parameters:
token (string)
market (string) : (string) 'binance' , 'binancefru' etc.. Строковая переменная названия биржи.
ticker_id (string) : (string) ticker in market ('btcusdt', 'ethusdt' etc...). Строковая переменная названия тикера (пары).
type_qty (string)
quantity (float) : (float) orders size. Размер ордера.
s_stop (float) : (float) price for activation stop order. Цена активации стоп-ордера.
leverageforqty (bool) : (bool) use leverage in qty. Использовать плечо при расчете количества или нет.
Returns: 'Change Stop Market Buy order (close short position)'. Смещает цену активации Маркетного стоп-ордер на снижения/закрытия текущего шорта.
open_long_position(token, market, ticker_id, type_qty, quantity, l_stop, leverageforqty)
Cancel and close all orders and positions by ticker , then open Long position by market price with stop order
Отменяет все лимитки и закрывает все позы по тикеру, затем открывает лонг по маркету с выставлением стопа (переворот позиции, при необходимости).
Parameters:
token (string)
market (string) : (string) 'binance' , 'binancefru' etc.. Строковая переменная названия биржи.
ticker_id (string) : (string) ticker in market ('btcusdt', 'ethusdt' etc...). Строковая переменная названия тикера (пары).
type_qty (string) : (string) type of quantity: 1. 'qty' or '' or na - standart (in coins), 2. 'quqty'- in assets (usdt,btc,etc..), 3.open% - open position(futures) or buy (spot) in % of base 4. close% - close in % of position (futures) or sell (spot) coins in % for current quantity
quantity (float) : (float) orders size. Размер ордера.
l_stop (float) : (float). Price for activation stop loss. Цена активации стоп-лосса.
leverageforqty (int) : (bool) use leverage in qty. Использовать плечо при расчете количества или нет.
Returns: 'command_all_close + LongMarket + long_stop.
open_short_position(token, market, ticker_id, type_qty, quantity, s_stop, leverageforqty)
Cancel and close all orders and positions , then open Short position by market price with stop order
Отменяет все лимитки и закрывает все позы по тикеру, затем открывает шорт по маркету с выставлением стопа(переворот позиции, при необходимости).
Parameters:
token (string)
market (string) : (string) 'binance' , 'binancefru' etc.. Строковая переменная названия биржи.
ticker_id (string) : (string) ticker in market ('btcusdt', 'ethusdt' etc...). Строковая переменная названия тикера (пары).
type_qty (string) : (string) type of quantity: 1. 'qty' or '' or na - standart (in coins), 2. 'quqty'- in assets (usdt,btc,etc..), 3.open% - open position(futures) or buy (spot) in % of base 4. close% - close in % of position (futures) or sell (spot) coins in % for current quantity
quantity (float) : (float) orders size. Размер ордера.
s_stop (float) : (float). Price for activation stop loss. Цена активации стоп-лосса.
leverageforqty (int) : (bool) use leverage in qty. Использовать плечо при расчете количества или нет.
Returns: 'command_all_close + ShortMarket + short_stop'.
open_long_trade(token, market, ticker_id, type_qty, quantity, l_stop, qty_ex1, price_ex1, qty_ex2, price_ex2, qty_ex3, price_ex3, leverageforqty)
Cancell and close all orders and positions , then open Long position by market price with stop order and take 1 ,take 2, take 3
Отменяет все лимитки и закрывает все позы по тикеру, затем открывает лонг по маркету с выставлением стопа и 3 тейками (переворот позиции, при необходимости).
Parameters:
token (string)
market (string) : (string) 'binance' , 'binancefru' etc.. Строковая переменная названия биржи.
ticker_id (string) : (string) ticker in market ('btcusdt', 'ethusdt' etc...). Строковая переменная названия тикера (пары).
type_qty (string) : (string) type of quantity: 1. 'qty' or '' or na - standart (in coins), 2. 'quqty'- in assets (usdt,btc,etc..), 3.open% - open position(futures) or buy (spot) in % of base 4. close% - close in % of position (futures) or sell (spot) coins in % for current quantity
quantity (float) : (float) enter order size, see at type_qty. Размер ордера входа, согласно type_qty.
l_stop (float) : (float). Price for activation stop loss. Цена активации стоп-лосса.
qty_ex1 (float) : (float). Quantity for 1th take see at type_qty, if = 0 string for order dont set. Размер лимитного ордера для 1го тейка, согласно type_qty.. Если 0, то строка для этого тейка не формируется
price_ex1 (float) : (float). Price for 1th take , if = 0 string for order dont set. Цена лимитного ордера для 1го тейка. Если 0, то строка для этого тейка не формируется
qty_ex2 (float) : (float). Quantity for 2th take see at type_qty, if = 0 string for order dont set. Размер лимитного ордера для 2го тейка, согласно type_qty..Если 0, то строка для этого тейка не формируется
price_ex2 (float) : (float). Price for 2th take, if = 0 string for order dont set. Цена лимитного ордера для 2го тейка. Если 0, то строка для этого тейка не формируется
qty_ex3 (float) : (float). Quantity for 3th take see at type_qty, if = 0 string for order dont set. Размер лимитного ордера для 2го тейка, согласно type_qty..Если 0, то строка для этого тейка не формируется
price_ex3 (float) : (float). Price for 3th take, if = 0 string for order dont set. Цена лимитного ордера для 3го тейка. Если 0, то строка для этого тейка не формируется
leverageforqty (int)
Returns: 'cancel_all_close + LongMarket + long_stop + CloseLongLimit1 + CloseLongLimit2+CloseLongLimit3'.
open_short_trade(token, market, ticker_id, type_qty, quantity, s_stop, qty_ex1, price_ex1, qty_ex2, price_ex2, qty_ex3, price_ex3, leverageforqty)
Cancell and close all orders and positions , then open Short position by market price with stop order and take 1 and take 2
Отменяет все лимитки и закрывает все позы по тикеру, затем открывает шорт по маркету с выставлением стопа и 3 тейками (переворот позиции, при необходимости).
Parameters:
token (string)
market (string) : (string) 'binance' , 'binancefru' etc.. Строковая переменная названия биржи.
ticker_id (string) : (string) ticker in market ('btcusdt', 'ethusdt' etc...). Строковая переменная названия тикера (пары).
type_qty (string)
quantity (float)
s_stop (float) : (float). Price for activation stop loss. Цена активации стоп-лосса.
qty_ex1 (float) : (float). Quantity for 1th take see at type_qty, if = 0 string for order dont set. Размер лимитного ордера для 1го тейка, согласно type_qty.. Если 0, то строка для этого тейка не формируется
price_ex1 (float) : (float). Price for 1th take , if = 0 string for order dont set. Цена лимитного ордера для 1го тейка. Если 0, то строка для этого тейка не формируется
qty_ex2 (float) : (float). Quantity for 2th take see at type_qty, if = 0 string for order dont set. Размер лимитного ордера для 2го тейка, согласно type_qty..Если 0, то строка для этого тейка не формируется
price_ex2 (float) : (float). Price for 2th take, if = 0 string for order dont set. Цена лимитного ордера для 2го тейка. Если 0, то строка для этого тейка не формируется
qty_ex3 (float) : (float). Quantity for 3th take see at type_qty, if = 0 string for order dont set. Размер лимитного ордера для 2го тейка, согласно type_qty..Если 0, то строка для этого тейка не формируется
price_ex3 (float) : (float). Price for 3th take, if = 0 string for order dont set. Цена лимитного ордера для 3го тейка. Если 0, то строка для этого тейка не формируется
leverageforqty (int)
Returns: 'command_all_close + ShortMarket + short_stop + CloseShortLimit + CloseShortLimit(2)'.
Multi_LongLimit(token, market, ticker_id, type_qty, qty1, price1, qty2, price2, qty3, price3, qty4, price4, qty5, price5, qty6, price6, qty7, price7, qty8, price8, leverageforqty)
8 or less Buy orders with limit price and quantity.
До 8 Лимитных ордеров на покупку(в лонг).
Parameters:
token (string) : (integer or 0) token for trade in system, if = 0 then token part mess is empty. Токен, При значениb = 0 не включается в формирование строки алерта.
market (string) : (string) Spot 'binance' , 'bybit' . Futures ('binancefru','binancefro','bybitfu', 'bybitfi'). Строковая переменная названия биржи.
ticker_id (string) : (string) ticker in market ('btcusdt', 'ethusdt' etc...). Строковая переменная названия тикера (пары).
type_qty (string) : (string) type of quantity: 1. 'qty' or '' or na - standart (in coins), 2. 'quqty'- in assets (usdt,btc,etc..), 3.open% - open position(futures) or buy (spot) in % of base 4. close% - close in % of position (futures) or sell (spot) coins in % for current quantity
qty1 (float)
price1 (float)
qty2 (float)
price2 (float)
qty3 (float)
price3 (float)
qty4 (float)
price4 (float)
qty5 (float)
price5 (float)
qty6 (float)
price6 (float)
qty7 (float)
price7 (float)
qty8 (float)
price8 (float)
leverageforqty (bool) : (bool) use leverage in qty. Использовать плечо при расчете количества или нет.
Returns: 'Limit Buy order'. Лимитный ордер на покупку (лонг).
(2) Two AlertsCurrent Trading View free plan allows only ONE active alert.
This simple indicator Allows to trigger this ONE and ONLY alert when price reaches Higher, or Lower price level.
You can set levels and turn alerts for them on/off in settings, or by just drag-n-dropping Horizontal lines on the chart.
To set the only alert you need to create new alert, and change it's following parameters :
condition : 2alerts
Any alert function() call
Feel free to modify it on your needs.
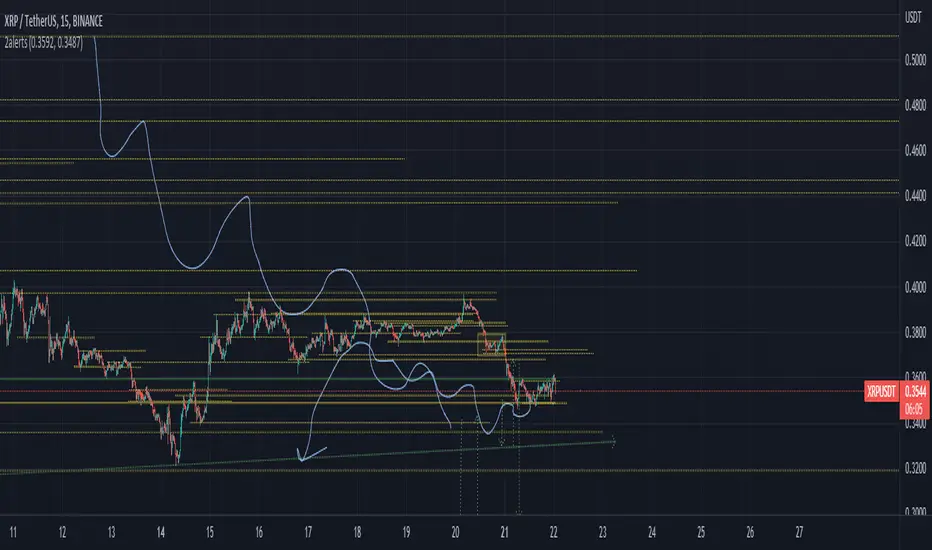
SuperTrend Multi Time Frame Long and Short Trading Strategy
Hello All
This is non-repainting Supertrend Multi Time Frame script, I got so many request on Supertrend with Multi Time Frame. This is for all of them ..I am making it open for all so you can change its coding according to your need.
How the Basic Indicator works
SuperTrend is one of the most common ATR based trailing stop indicators.
In this version you can change the ATR calculation method from the settings. Default method is RMA.
The indicator is easy to use and gives an accurate reading about an ongoing trend. It is constructed with two parameters, namely period and multiplier. The default values used while constructing a Supertrend indicator are 10 for average true range or trading period and three for its multiplier.
The average true range (ATR) plays an important role in 'Supertrend' as the indicator uses ATR to calculate its value. The ATR indicator signals the degree of price volatility .
The buy and sell signals are generated when the indicator starts plotting either on top of the closing price or below the closing price. A buy signal is generated when the ‘Supertrend’ closes above the price and a sell signal is generated when it closes below the closing price.
It also suggests that the trend is shifting from descending mode to ascending mode. Contrary to this, when a ‘Supertrend’ closes above the price, it generates a sell signal as the colour of the indicator changes into red.
A ‘Supertrend’ indicator can be used on spot, futures, options or forex, or even crypto markets and also on daily, weekly and hourly charts as well, but generally, it fails in a sideways-moving market.
How the Strategy works
This is developed based on SuperTrend.
Use two time frame for confirm all entry signals.
Two time frame SuperTrend works as Trailing stop for both long and short positions.
More securely execute orders, because it is wait until confine two time frames(example : daily and 30min)
Each time frame developed as customisable for user to any timeframe.
User can choose trading position side from Long, Short, and Both.
Custom Stop Loss level, user can enter Stop Loss percentage based on timeframe using.
Multiple Take Profit levels with customisable TP price percentage and position size.
Back-testing with custom time frame.
This strategy is develop for specially for automation purpose.
The strategy includes:
Entry for Long and Short.
Take Profit.
Stop Loss.
Trailing Stop Loss.
Position Size.
Exit Signal.
Risk Management Feature.
Backtesting.
Trading Alerts.
Use the strategy with alerts
This strategy is alert-ready. All you have to do is:
Go on a pair you would like to trade
Create an alert
Select the strategy as a Trigger
Wait for new orders to be sent to you
This is develop for specially for automating trading on any exchange, if you need to get that automating service for this strategy or any Tradingview strategy or indicator please contact me I am have 8 year experience on that field.
I hope you enjoy it!
Thanks,
Ranga

Crossover Alerts for Yesterday O/H/L/C , Today Vwap [Zero54]This is a very simple script/indicator that trigger alerts every time the script triggers the following conditions.
1) Script crosses yesterday's (previous day's) high
2) Script crosses yesterday's (previous day's) low
3) Script crosses yesterday's (previous day's) open
4) Script crosses yesterday's (previous day's) close
5) Script crosses today's vwap.
I developed this to keep track of the scripts I follow and I find it useful. Hope you will find it useful too.
Steps to use:
1) Open the ticker for which you want to set the alerts.
2) Add this indicator to the chart.
3) Right Click on the text and set choose "Add Alert"
4) After you have done with setting up the alert, feel free to remove the indicator from the chart. It is not necessary for the indicator to be added in the chart in order for it to work.
5) Repeat 1-4 for all the scripts for which you want to set the alerts.
Be advised: During market open, if you have set alerts for multiple scripts, a tsunami of alerts may be triggered.
If you like this alert indicator, please like/boost it. Feel free to re-use this code however you may wish to. Cheers!

Squeeze Momentum Strategy [LazyBear] Buy Sell TP SL Alerts-Modified version of Squeeze Momentum Indicator by @LazyBear.
-Converted to version 5,
-Taken inspiration from @KivancOzbilgic for its buy sell calculations,
-Used @Bunghole strategy template with Take Profit, Stop Loss and Enable/Disable Toggles
-Added Custom Date Backtesting Module
------------------------------------------------------------------------------------------------------------------------
All credit goes to above
Problem with original version:
The original Squeeze Momentum Strategy did not have buy sell signals and there was alot of confusion as to when to enter and exit.
There was no proper strategy that would allow backtesting on which further analysis could be carried out.
There are 3 aspects this strategy:
1 ) Strategy Logic (easily toggleable from the dropdown menu from strategy settings)
- LazyBear (I have made this simple by using Kivanc technique of Momentums Moving Average Crossover, BUY when MA cross above signal line, SELL when crossdown signal line)
- Zero Crossover Line (BUY signal when crossover zero line, and SELL crossdown zero line)
2) Long Short TP and SL
- In strategies there is usually only 1 SL and 1 TP, and it is assumed that if a 2% SL giving a good profit %, then it would be best for both long and short. However this is not the case for many. Many markets/pairs, go down with much more speed then they go up with. Hence once we have a profitable backtesting setting, then we should start optimizing Long and Short SL's seperately. Once that is done, we should start optimizing for Long and Short TP's separately, starting with Longs first in both cases.
3) Enable and Disable Toggles of Long and Short Trades
- Many markets dont allow short trades, or are not suitable for short trades. In this case it would be much more feasible to disable "Short" Trading and see results of Long Only as a built in graphic view of backtestor provides a more easy to understand data feed as compared to the performance summary in which you have to review long and short profitability separately.
4) Custom Data Backtesting
- One of most crucial aspects while optimizing for backtesting is to check a strategies performance on uptrends, downtrend and sideways markets seperately as to understand the weak points of strategy.
- Once you enable custom date backtesting, you will see lines on the chart which can be dragged left right based on where you want to start and end the backtesting from and to.
Note:
- Not a financial advise
- Open to feedback, questions, improvements, errors etc.
- More info on how the squeeze momentum works visit LazyBear indicator link:
Happy Trading!
Cheers
M Tahreem Alam @mtahreemalam

Signal generatorThis simple script generates signals for testing the connection from TradingView to a REST API client via the webhook and demonstrates very basic concepts of gerenating alerts within the script.
This script also demonstrates how to visualize when a buy or a sell should take place and how to use diagnostics text for bug fixes/informational purposes.
This is for testing and learning only. Do not use with real money as losses WILL occur. This script is for educational purposes only and should only be used with demo accounts, never with real money .
Buy signals are generated when closing price is less then opening price.
Sell Signals are generated when closing price is greater then opening price.
Can also be used to test signal counting and very rudimentary dollar cost averaging.

VolT by empowerTVolT is conceived to expose and alert volume volatility.
Using 21-candle moving average volume values compared to the current candle volume, you can graphically see the volume as it comes in - as a percentage of the historic 1X volume moving average.
Getting close to 2X or 5X of the 21-candle SMA? Just glance at the transparent plots behind the volume bars - or the actual percentage value in yellow.
Never wonder again how much volume that bar is compared to previous volume - now you know. Set alerts based on the volume crossing your chosen volume SMA. You'll never be surprised that the hedgies loaded up and left you behind, because you'll be right there loading up with them. (Let me know if you need help setting the alerts...)
As always, your feedback and criticisms are appreciated.
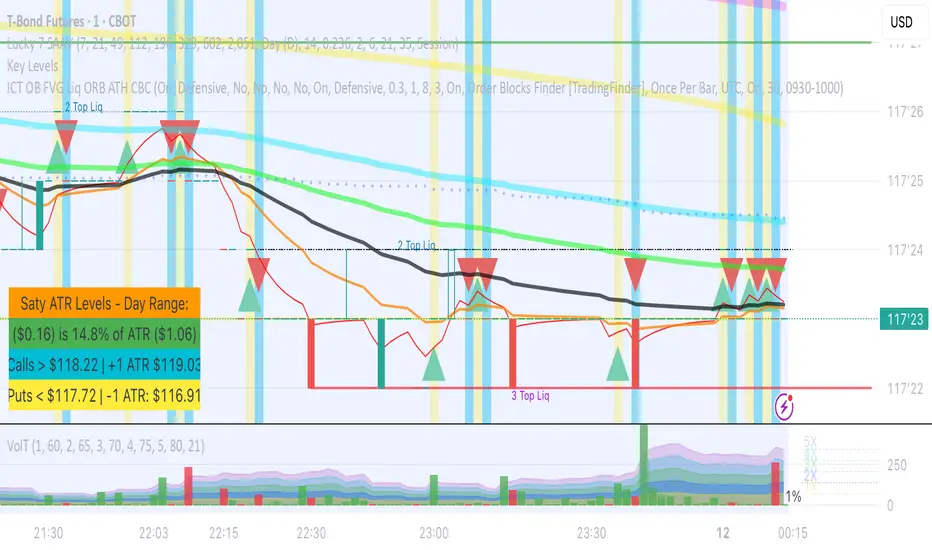
Multi-timeframe MAs + Stoch RSI SignalsHello traders,
I welcome you to my first published script on TradingView: “Multi-timeframe Moving Averages + Stochastic RSI”.
The script is based on a simple formula: Buy signals are generated when a fast moving average is above a slower moving average (uptrend) and the Stochastic RSI K line is crossing above the oversold level (entry).
Sell signals are generated when a fast moving average is below a slower moving average (downtrend) and the Stochastic RSI K line is crossing below the overbought level (entry).
This indicator works best in strong trends!
**Please note the above example has repainting turned on which may produce unrealistic results when viewing historical data. See below for more information regarding this and how you can turn it off.**
The user has the following inputs:
- Option to change the Stochastic RSI settings, including the oversold and overbought levels.
- Option to enter any value for both the Fast Moving Average and the Slow Moving Average.
- Option to change between EMA or SMA for each moving average.
- Multiple time frames to choose from, as well as the ability to selectively turn off individual time frames (both plots and alerts).
(Default time frames are 1 hour, 4 hour, and Daily. You can have a 4th time frame by changing your current time frame to something lower than the other 3 time frames)
- Turn on/off repainting: If repainting is turned on you will get an alert and buy/sell signal on chart immediately when condition is met, however the signal may disappear from chart if the condition reverses during the same candle.
If repainting is turned off, the indicator will wait for the candle to close before issuing the alert and painting the signal on chart.
For higher time frames, the indicator will wait for the candle in the higher time frame to close before issuing a signal if repaint is turned off. Default is set to Repaint on, so please be aware of this if you do not want repainting.
How to use alerts:
- Before you do anything, make sure your current time frame is the lowest time frame you’d like alerts on, as you will still receive alerts for the higher time frames you selected in settings.
- Once you have all the settings changed to how you like, save your chart first. Then right click on any of the indicator’s buy/sell signals on the chart and click “Add Alert on MAs + Stoch RSI”.
- Make sure “Any alert() function call” is selected under the Condition.
- You can delete or change the text in “Alert name” if you want as the alert message is already built into the indicator, and it will tell you in the alert message which asset and time frame to buy or sell.
Other things to note:
- The indicator will not display the buy/sell signals of lower time frames when you are on a higher time frame. This was done purposely to reduce clutter on the chart when you switch to higher time frames.
- While the alert message will tell you which time frame a signal was generated, the plots on the chart will instead show “Buy/Sell TF1, or TF2, or TF3”.
If the signal is from the current time frame that the alert was created on, then it will simply show “Buy” or “Sell”.
Hope you guys enjoy using this one, please drop a like if you found it useful. If anyone wants to modify my script in any way, please just credit me for the original work when you publish the script. Good luck!

Custom Screener with Alerts V2 [QuantNomad]TradingView just recently announced the alert() function that allows you to create dynamic alerts from both strategies and studies.
So I decided to update custom screener I published before. It was based on alerts from orders in strategies, that was the only way to create dynamic alerts in PineScript at that point.
With the alert() function code become cleaner and more readable.
It works for up to 40 symbols at the same time.
You can create an alert from it easily by selecting screener name from the list and then selecting "Any alert() function call".
No additional configuration is required, message and alert on close I set up in the code.
I created as an example a screener that tracks both overbought (RSI > 70) and oversold stocks (RSI < 30).
To create your own screener you have to change only screenerFunc().
By design it should output 2 values:
cond - True/False Boolean variable. Should this instrument be displayed in the screener?
value - Additional numeric value you can display in your screener. I display RSI level for selected stocks for example.
Link to the old screener:
Disclaimer
Please remember that past performance may not be indicative of future results.
Due to various factors, including changing market conditions, the strategy may no longer perform as good as in historical backtesting.
This post and the script don’t provide any financial advice.
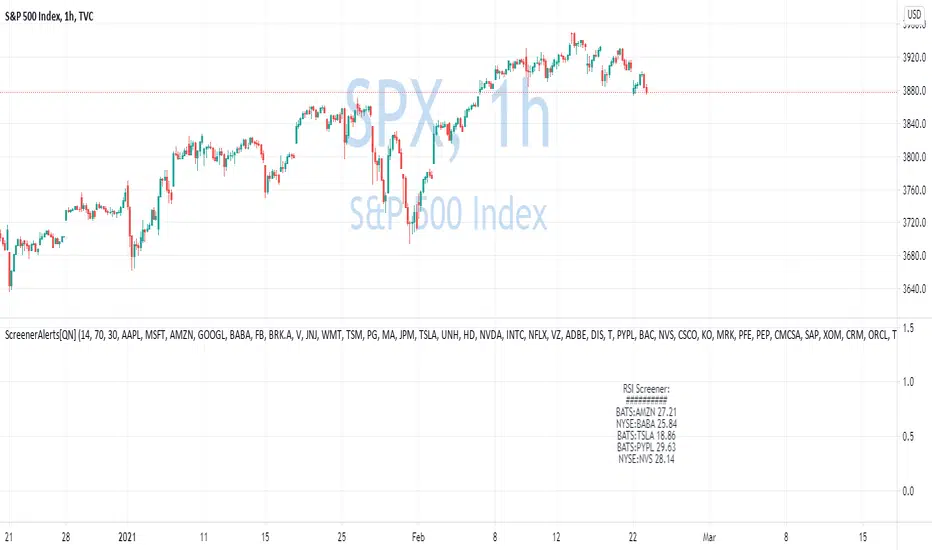
Fancy strategy alerts example [QuantNomad]Alerts on strategies were introduced just recently in TradingView.
These alerts have an alert_message placeholder which allows you to compose in PineScript very complex alerts and insert quite a lot of information in them.
This is just very simple example of how they can look like.
