COIN-Clean Market Structure & Trend Confirmation TP(Updated)COIN-Clean Market Structure & Trend Confirmation TP(Updated) — COIN (Simple Trend + Buy/Sell Confirmation + Take-Profit Targets)
This indicator is designed to help you trade COIN by clearly showing trend direction, confirmation signals, and predefined take-profit levels. It removes guesswork and helps you stay on the right side of the move.
HOW TO LOAD
Add the indicator to a COIN chart. Turn on Extended Hours for best results. The default settings are already optimized and do not need to be changed.
THE RIBBON (WHAT TO TRADE)
The ribbon shows the overall trend.
Teal ribbon = price is trending up (look for BUY setups).
Red ribbon = price is trending down (look for SELL setups).
Gray ribbon = no clear trend (do not trade).
If the ribbon is gray, the indicator will block signals to protect you from choppy markets.
BULL AND BEAR DOTS (TREND CHANGE ALERTS)
Bull dot appears when the trend turns bullish.
Bear dot appears when the trend turns bearish.
These dots are early warnings, not entries. Always wait for a BUY or SELL arrow before taking a trade.
BUY AND SELL ARROWS (WHEN TO ENTER)
BUY arrows appear only when conditions strongly favor upward movement.
SELL arrows appear only when conditions strongly favor downward movement.
These arrows are confirmation signals. Enter only after the arrow appears.
Not every move will get a signal. Fewer, higher-quality signals are intentional.
OPENING BIAS (FIRST MINUTES PROTECTION)
Right after the market opens, the indicator sets a directional bias.
During this time, it will only allow trades in the safer direction.
This helps avoid getting chopped up during the opening volatility.
TAKE-PROFIT TARGETS AND STOP
When a BUY or SELL arrow appears, take-profit levels automatically show on the chart:
TP1, TP2, and TP3 are profit targets.
STOP is where the trade is considered wrong.
You can scale out at each target or exit fully at any level.
Only the most recent targets are shown to keep the chart clean.
SIMPLE WAY TO USE IT
Check the ribbon color (teal or red).
Ignore the chart if the ribbon is gray.
Wait for a BUY or SELL arrow.
Use the take-profit targets and stop provided.
Do not chase moves without arrows.
IMPORTANT NOTES
This indicator does not repaint confirmed signals.
It is meant to keep trading simple and disciplined.
It works best during strong trend days, not sideways markets.
带和通道

Market + Direction + Entry + Hold + Exit v1.5 FINALOverview
This script is a complete trend-based trading framework designed to filter market conditions, determine directional bias, detect high-quality pullback entries, manage active trades, and identify trend-weakening exit points.
It is optimized for NQ futures, Gold (XAUUSD), and Bitcoin, with adaptive parameters for each asset.
The logic focuses on trading only when conditions are favorable, aligning entries with the primary trend, and avoiding low-probability setups.
1. Market Condition Filter
Before any signal appears, the script checks whether the market is active using three conditions:
ATR compared to ATR moving average (volatility condition)
Volume compared to average volume (liquidity condition)
Price distance from VWAP (suppression of mean-reversion environments)
A trade environment is considered active when at least two of these three conditions are positive.
2. Trend Direction Filter
Directional bias is defined by:
EMA21 relative to EMA55
Price relative to VWAP
Heikin-Ashi structure
When these conditions align, the script switches into long-only or short-only mode.
No counter-trend signals are displayed.
3. Entry Logic (L, L2, L3 and S, S2, S3)
The system identifies pullback entries within a confirmed trend.
Long entries require:
Uptrend confirmation
Price dipping toward EMA21 or EMA55
A constructive Heikin-Ashi candle
Market environment active
Short entries mirror the same structure in bearish conditions.
Re-entries (L2, L3, S2, S3) are given only if the trend remains intact after the first entry.
4. Hold Logic
A hold signal appears if momentum remains aligned with the trend.
Momentum is evaluated using the Stochastic indicator (K and D lines).
5. Exit Logic
An exit signal appears when:
The recent structural low (for longs) or high (for shorts) is broken, and
The EMA slope indicates weakening trend strength
This combination identifies high-probability trend exhaustion.
How to Use
Add the script to your chart.
Select an asset preset (NQ, GOLD, BTC).
Wait for the market to be active.
Follow the entry signals (L, L2, L3 or S, S2, S3).
Hold signals help confirm continuation.
Exit signals indicate potential trend reversal or weakness.
Feature Summary
Market environment filter
Trend direction filter
Pullback-based entry system
Multi-stage re-entry framework
Momentum-based hold signal
Structure-based exit
Asset-adaptive parameters
Clean chart visualization
Disclaimer
This script is for research and educational use.
It does not constitute financial advice.
Always backtest before using in live markets.
개요
이 스크립트는 시장 상태 필터링, 추세 방향 판단, 고품질 눌림목 진입, 보유 판단, 추세 약화 기반 청산까지 모두 포함하는 완전한 트레이딩 프레임워크입니다.
NQ, 골드(XAUUSD), 비트코인에 맞게 최적화되어 있습니다.
1. 시장 필터
다음 세 가지 중 두 가지 이상이 충족될 때만 매매 환경을 ‘활성’으로 판단합니다.
ATR 기준 변동성 체크
거래량 활성도 체크
가격의 VWAP 거리 체크
2. 방향(추세) 필터
다음 조건을 기반으로 상승·하락 추세를 결정합니다.
EMA21 vs EMA55
가격 vs VWAP
Heikin-Ashi 구조
이 조건이 일치할 때만 롱 전용 또는 숏 전용 모드로 진입합니다.
3. 진입 로직
추세가 유지되는 상태에서 EMA21 또는 EMA55까지 눌림이 나올 때
L 또는 S 신호를 제공합니다.
추세가 유지되면 L2/L3, S2/S3 재진입 신호가 추가로 발생합니다.
4. 보유(Hold)
모멘텀이 추세 방향과 일치할 때 보유 신호를 제공합니다.
5. 청산(Exit)
다음 두 조건이 동시에 나타날 때 청산 신호가 표시됩니다.
직전 구조(스윙)가 붕괴될 때
EMA 기울기가 약화될 때
사용 방법
차트에 스크립트를 추가합니다.
자산 프리셋(NQ, GOLD, BTC)을 선택합니다.
시장이 활성일 때만 신호를 참고합니다.
L/S 진입 신호와 보유/청산 신호를 활용해 매매 흐름을 관리합니다.

EMA 8 / 20 / 200Created to easily use the 8/20/200 strategy.
This indicator is designed to give a clear, multi-timeframe view of trend, momentum, and structure using three exponential moving averages.
1. Trend direction (EMA 200 – pink)
The 200 EMA acts as the long-term trend filter.
Price above the 200 EMA suggests a bullish market bias.
Price below the 200 EMA suggests a bearish market bias.
Many traders avoid taking trades against this higher-timeframe direction.
2. Momentum and trade bias (EMA 20 – blue)
The 20 EMA reflects short-term momentum.
When price respects the 20 EMA in an uptrend, pullbacks often provide continuation entries.
In downtrends, the 20 EMA frequently acts as dynamic resistance.
3. Entry timing (EMA 8 – yellow)
The 8 EMA is a fast reaction line used for precise timing.
Crosses of the 8 EMA over the 20 EMA can signal momentum shifts.
Strong trends often show price holding above (or below) the 8 EMA during impulse moves.
4. Confluence and trade filtering
The indicator works best when the EMAs are aligned:
Bullish alignment: EMA 8 > EMA 20 > EMA 200
Bearish alignment: EMA 8 < EMA 20 < EMA 200
Misaligned EMAs usually indicate consolidation or low-probability conditions.
5. Risk management context
EMAs can act as dynamic support and resistance:
Stops are often placed beyond the 20 EMA or 200 EMA depending on trade horizon.
Loss of EMA structure is a warning sign that the trend may be weakening.
In short, the indicator is a trend-first, momentum-second framework that helps you decide when to trade, in which direction, and when to stay out.

Rainbow MA Cloud█ OVERVIEW
Rainbow MA Cloud displays 8 Moving Averages as a gradient-colored cloud to visualize trend direction and strength. The "rainbow" effect shows momentum through ribbon width, while perfect MA alignment signals strong trending conditions.
█ CONCEPTS
The indicator uses 8 MAs with Fibonacci-based default lengths (8, 13, 21, 34, 55, 89, 144, 233) to create a layered view of price momentum across multiple timeframes.
Perfect Alignment Detection:
• Bullish Alignment — All 8 MAs in ascending order (MA1 > MA2 > ... > MA8)
Indicates strong uptrend with momentum across all timeframes
• Bearish Alignment — All 8 MAs in descending order (MA1 < MA2 < ... < MA8)
Indicates strong downtrend with aligned selling pressure
• Mixed — MAs are not in sequential order, suggesting consolidation or transition
Ribbon Width:
• Widening ribbon = Trend acceleration, increasing momentum
• Narrowing ribbon = Trend weakening, potential reversal or consolidation
█ FEATURES
1 — MA Configuration
Choose from EMA, SMA, WMA, VWMA, or HMA calculation methods.
All 8 MA lengths are fully customizable.
2 — Color Themes
Five built-in themes: Rainbow, Warm, Cool, Neon, Mono.
Creates visually distinct gradient from fast to slow MAs.
3 — Alignment Background
Green background during bullish alignment.
Red background during bearish alignment.
Helps quickly identify strong trending periods.
4 — Trend Signals
Labels appear when perfect alignment forms.
"BULL ALIGN" for bullish, "BEAR ALIGN" for bearish.
5 — Information Panel
Real-time display of alignment status, trend strength percentage,
ribbon width, price position relative to cloud, and MA values.
█ HOW TO USE
Entry Signals:
• Look for alignment signals (BULL/BEAR ALIGN) as trend confirmation
• Enter long when bullish alignment forms with price above cloud
• Enter short when bearish alignment forms with price below cloud
Trend Following:
• Stay in position while alignment background color persists
• Widening ribbon confirms trend continuation
• Exit or reduce when alignment breaks (background disappears)
Support/Resistance:
• Cloud edges act as dynamic support (bullish) or resistance (bearish)
• Price entering cloud suggests consolidation or potential reversal
█ LIMITATIONS
• Alignment signals are lagging by nature (based on MA crossovers)
• Works best on trending markets; generates mixed signals during ranging periods
• Ribbon width measurement uses outer MAs only (MA1 vs MA8)
█ COMPANION INDICATOR
Use "Rainbow MA Width" indicator for detailed Z-Score analysis of ribbon expansion/contraction patterns.

MA20 ATR Trend Failure FilterA volatility-adaptive filter designed to identify early trend invalidation.
This indicator combines a 20-period Moving Average (MA20) with Average True Range (ATR) to dynamically define a lower volatility boundary.
When price closes below this boundary, it signals that the current trend is no longer valid and risk is increasing.
Core Concept(核心思想)
MA defines the trend baseline
ATR measures current market volatility
MA − k × ATR forms a dynamic risk threshold
A close below this threshold = trend failure
👉 中文补充:
这不是反转指标,而是趋势失效过滤器,用于避免在趋势已经被破坏后继续持仓或加仓。
How It Works
Calculate MA20 as the trend reference
Calculate ATR(14) as volatility proxy
Build adaptive bands:
Upper Band = MA20 + k × ATR
Lower Band = MA20 − k × ATR
If close < Lower Band, trend is considered failed
The ATR multiplier k automatically adjusts the tolerance based on volatility, avoiding rigid fixed-percentage rules.
Visual Elements
Yellow line: MA20
Green band: MA20 + k × ATR
Red band: MA20 − k × ATR (key risk boundary)
Red triangle + “FAIL” label: Trend failure signal
Optional background shading to highlight risk zones
Typical Use Cases
Trend-following strategies (exit / reduce exposure)
Breakout strategies (filter false continuation)
Risk management overlay (non-intrusive, no repaint)
Combine with HMA, SuperTrend, structure-based entries
👉 中文补充:
非常适合作为**“不该再拿”的客观判断条件**,而不是频繁交易信号。
Why This Indicator
Volatility-adaptive (ATR-based)
No future data, no repaint
Simple logic, strong risk control
Works across stocks, crypto, futures, indices
This tool is designed to answer one question only:
Is the current trend still valid?
Parameters
MA Length (default: 20)
ATR Length (default: 14)
ATR Multiplier k (default: 0.8)
Lower k → stricter risk control
Higher k → more tolerance, fewer false signals SSE:600595

Momentum Burst Pullback System v66 * Detects **momentum “bursts”** using:
* **Keltner breakout** (high above upper band for long, low below lower band for short), and/or
* **MACD histogram extreme** (highest/lowest in a lookback window, with correct sign).
* Optional **burst-zone extension** keeps the burst “active” for N extra bars after the burst.
* Marks bursts with **K** (Keltner) and **M** (MACD) labels:
* Core burst labels use one color, extension labels use a different color.
* Tracks the most recent burst as the **dominant side** (long or short), and stores burst “leg” anchors (high/low context).
* Adds **structure-based invalidation**:
* On a new **core burst**, it locks the most recent **confirmed swing** level (pivot):
* Long: locks the last confirmed **swing low**.
* Short: locks the last confirmed **swing high**.
* After the burst, if price **breaks that locked level**, the burst regime is **cancelled** (and any pending setup on that side is dropped).
* Finds **pullback setups** after a dominant burst (and not inside the active burst zone), within min/max bars:
* Long pullback requires a sequence of **lower highs** and price still below the burst high.
* Short pullback requires **higher lows** and price still above the burst low.
* Optional background shading highlights pullback bars.
* On pullback bars, plots **static TP/SL crosses** using ATR:
* Anchor is the pullback bar’s high (long) or low (short).
* TP/SL are ± ATR * multiple.
* TP plots are visually classified (bright vs faded) based on whether TP would exceed the prior burst extreme.
* Maintains a **state-machine entry + trailing stop**:
* Sets a “waiting” trigger on pullback.
* Enters when price breaks the trigger (high break for long, low break for short).
* Trails a stop using **R-multiples**, with different behavior pre-break-even, post-break-even, and near-TP.
* Optionally draws the trailing stop as horizontal line segments.
* Optionally shows a **last-bar label** with the most recent pullback’s TP and SL values.

Rainbow MA Width█ OVERVIEW
Rainbow MA Width is a companion indicator for Rainbow MA Cloud. It displays ribbon width as a normalized Z-Score, allowing traders to visualize trend momentum expansion and contraction relative to recent history.
█ CONCEPTS
Z-Score Normalization:
Rather than displaying raw width values (which vary by asset and timeframe),
this indicator normalizes the ribbon width using Z-Score calculation:
Z-Score = (Current Width - Average Width) / Standard Deviation
Z-Score Interpretation:
• 0 = Average width (mean)
• +1 to +2 = Expanding (above average, strong trend)
• -1 to -2 = Contracting (below average, weakening trend)
• Beyond ±2 = Extreme (statistical outlier, potential reversal)
Width Calculation Modes:
• Outer — Distance between fastest and slowest MA: |MA1 - MA8|
• Average Gap — Mean of all adjacent MA gaps
• Total Gap — Sum of all adjacent MA gaps
█ FEATURES
1 — Width Mode Selection
Three methods to calculate ribbon width.
"Outer" recommended for aligned trends.
2 — Z-Score Period
Configurable lookback for mean and standard deviation.
Default 20 bars; increase for smoother, less reactive readings.
3 — Zone Fill Coloring
Cyan fill when expanding (Z > 0).
Orange fill when contracting (Z < 0).
Yellow fill for extreme values (|Z| > 2) as warning.
4 — Alignment Background
Green background during bullish alignment.
Red background during bearish alignment.
Synced with Rainbow MA Cloud for consistency.
5 — Reference Lines
Horizontal lines at 0 (mean), ±1σ, and ±2σ levels.
Provides clear visual boundaries for interpretation.
6 — Raw Width Display
Optional secondary line showing original width percentage.
Useful for comparing normalized vs absolute values.
█ HOW TO USE
Trend Confirmation:
• Z-Score rising above 0 confirms trend acceleration
• Z-Score staying above +1 indicates sustained strong momentum
• Use alongside alignment background for confluence
Reversal Warning:
• Z-Score exceeding +2 suggests overextension (yellow warning zone)
• Z-Score dropping below -2 indicates extreme contraction
• Extreme readings often precede trend reversals or consolidation
Entry Timing:
• Enter trends when Z-Score crosses above 0 (expansion beginning)
• Avoid entries when Z-Score is at extreme highs (potential exhaustion)
• Consider exits when Z-Score peaks and begins declining
█ LIMITATIONS
• Z-Score is relative to lookback period; different periods give different readings
• Extreme zones (±2) are statistical guides, not guarantees
• Best used in conjunction with Rainbow MA Cloud for full context
█ ALERTS
Four built-in alert conditions:
• Z-Score crosses above/below zero
• Z-Score enters extreme high/low zones (±2)

Highlight Weekday (any timeframe)You can select any specific day to highlight and see the movement on that particular day

changekon.com_VolatileIndicatorIndicator Description
This custom indicator is a hybrid trend and volatility-based tool designed to identify potential buy and sell zones in the market. It combines multiple moving average methodologies and volatility analysis to provide more reliable trading signals.
The indicator integrates Simple Moving Average (SMA), Exponential Moving Average (EMA), and Running Moving Average (RMA) to capture both short-term momentum and longer-term trend direction. By blending these averages, the indicator reduces the lag and noise commonly associated with using a single moving average.
In addition, Bollinger Bands are used to measure market volatility and identify overbought and oversold conditions. The width and interaction of price with the bands help assess whether the market is in a trending or ranging state.
A volatility filter is applied to avoid low-quality signals during low-volatility or choppy market conditions. Buy signals are generated when price action aligns with bullish trend confirmation and favorable volatility conditions. Conversely, sell signals are triggered when bearish trend criteria and volatility confirmation are met.
Overall, this indicator is designed to improve signal accuracy by combining trend strength, momentum, and volatility into a single decision-making framework, making it suitable for both trend-following and breakout trading strategies.

SAYO Zones📄 Description
🔹 SAYO Zones is a clean and objective trading tool designed for swing traders and day traders, suitable for stocks, crypto, and futures markets.
🔹 The indicator automatically maps dynamic Fibonacci-based price zones and combines them with momentum timing to help traders focus only on high-quality areas of interest.
🔹 It works on all timeframes, from intraday charts to higher timeframe swing setups.
🔹 This tool is not a signal generator by itself. 🔹 It is a decision-support indicator built to improve clarity, patience, and execution.
🔍 What SAYO Zones Does
🔹 Automatically calculates dynamic Fibonacci ranges 🔹 Highlights key price zones where reactions are statistically more likely 🔹 Filters out low-quality trades by identifying no-trade (blue) zones 🔹 Combines WaveTrend structure with Stochastic momentum for timing 🔹 Designed to work on all markets and all timeframes, including futures
🎯 Core Concept
🔹 Markets move in ranges. 🔹 Not every level is worth trading.
🔹 SAYO Zones helps you: 🔹 Focus only on meaningful price areas 🔹 Avoid entries inside low-probability zones 🔹 Align structure and momentum for better entries 🔹 The goal is clarity over frequency.
🧭 How to Use
🔹 SAYO Zones is built as an advanced trading methodology, while remaining clear and accessible for beginners. 🔹 The indicator provides visual arrows when specific structural and momentum conditions align.
🔹 How to approach a trade: 🔹 Wait for price to reach a meaningful zone 🔹 Avoid trades inside blue zones 🔹 When an arrow appears, it signals that structure and momentum are aligned 🔹 Use momentum confirmation to validate the setup
🔹 Once confirmed: 🔹 Define your stop loss based on structure or zone boundaries 🔹 Define your take profit according to your risk-to-reward plan 🔹 Execute the trade based on your strategy rules
🔹 The arrows are not meant to be followed blindly. 🔹 They are execution signals designed to help you act only when conditions are favorable. 🔹 This approach encourages discipline, patience, and structured risk management.
📈 Best Use Cases
🔹 Swing trading stocks 🔹 Day trading stocks 🔹 Swing trading crypto 🔹 Day trading crypto 🔹 Futures trading (index, commodities, and crypto futures) 🔹 All timeframes: 5m, 15m, 1H, 4H, Daily 🔹 Range, pullback, and structure-based strategies
⚠️ Important Notes
🔹 SAYO Zones is not a buy or sell guarantee 🔹 No indicator predicts the future 🔹 Always apply proper risk management 🔹 Best results come from combining this tool with a complete trading plan
🧠 Why SAYO Zones
🔹 Most indicators show too much information. 🔹 SAYO Zones is designed to show only what matters. 🔹 Whether you are a beginner learning structured trading, or an advanced trader refining execution, this tool helps you trade with more confidence and consistency.
🔔 Alerts
🔹 Custom alerts are included to notify you when potential conditions align, allowing you to stay focused without watching the chart continuously.
📌 Final Thought
🔹 SAYO Zones is not about trading more. 🔹 It is about trading better.

WMD Weekly OR (IST) Sidweekly OR (First hour) and mid point for various instruments based on indian standard time.

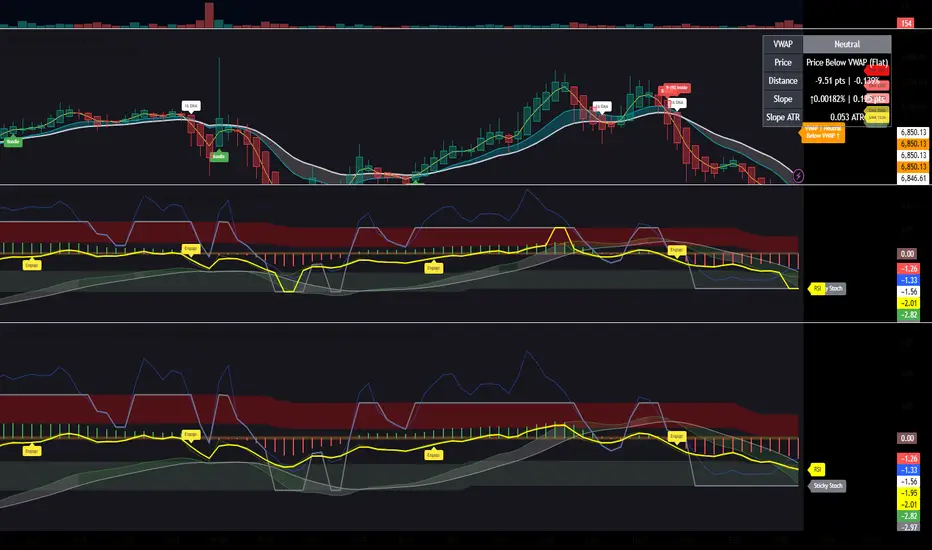
VWAP MasterclassThis script consolidates four critical market dimensions into a single, coherent framework, reducing chart clutter while increasing decision quality.
Quick overview (what this script does):
Combines VWAP with adaptive bands, EMA-based trend logic, Volume Profile with Rolling POC, and global trading sessions.
Enables context-driven decisions instead of isolated indicator signals.
Fully configurable for intraday, futures, index, and crypto trading.
TradingView Script Description
VWAP Combined is a multifunctional TradingView indicator that merges four proven analytical tools into one unified overlay:
VWAP with dynamic bands, EMA trend filtering with bar coloring, Volume Profile with Rolling POC, and global market sessions.
The VWAP can be anchored to multiple periods (Session, Week, Month, Quarter, Year, Earnings, etc.) and optionally extended with up to three volatility- or percentage-based bands. This allows precise identification of fair value, overextension, and mean-reversion zones.
The integrated EMA trend acts as a structural market filter. Candles can be colored based on their position relative to the EMA, making trend direction and regime immediately visible.
The Volume Profile analyzes traded volume over a configurable lookback window. It highlights volume concentrations, key acceptance areas, and the Rolling Point of Control (POC) directly on the chart—useful for identifying institutionally relevant price levels.
In addition, the script visualizes the major global trading sessions (London, New York, Tokyo, Sydney), either as background shading or as session high/low ranges. This provides immediate context on liquidity, volatility, and session-driven price behavior.
Use cases:
Intraday and scalping strategies
VWAP- and session-based trading
Contextual analysis for futures, indices, forex, and crypto markets
Objective:
Deliver maximum market context with minimal indicator overload—integrating price, volume, trend, and time into a single, professional-grade tool.

Supercombine Breakout V3This strategy is a trend-filtered breakout system with volatility-adaptive channels and ATR-based risk management, sized by % of equity risk per trade. Only use it on 30m BTC and ETH.

Day breakerDay breaker Script
Indicator Featuring VWAP with Target and Stop Loss
This setup is ideal for day trading, providing precise stop loss points. The chart also highlights yesterday's high, low, and close prices for your reference.This approach allows traders to make informed decisions by combining volume-weighted average price (VWAP) analysis with key historical price levels. By setting clear target and stop loss limits, traders can effectively manage risk while potentially maximizing their returns. The inclusion of yesterday’s high, low, and close prices offers valuable context, helping to identify potential support and resistance levels. This comprehensive strategy not only enhances technical analysis but also supports disciplined trading practices, enabling traders to stay focused and make confident moves in the fast-paced world of day trading.


Gold Levels MTF
// ────────────────────────────────────────────────────────────────────────────────
// GOLD LEVELS MTF - COMPLETE INDICATOR DESCRIPTION
// ────────────────────────────────────────────────────────────────────────────────
//
// DESCRIPTION:
// Gold Levels MTF is a professional technical indicator that analyzes asset price
// movement and displays support and resistance levels from all timeframes (Daily,
// Weekly, Monthly) using the Murray Math method based on Gann theory.
//
// MAIN FEATURES:
// 1. Multi-timeframe analysis - displays levels from Daily, Weekly, and Monthly timeframes
// 2. Automatic Murray Math level calculation (9 levels: 0/8 to 8/8)
// 3. Visual indication of level strength through colors and line styles
// 4. Level labels for easy identification
// 5. Automatic recalculation when volatility changes
//
// LEVEL TYPES:
//
// Extreme Overshoot (0/8 and 8/8) - Red color, solid line
// Final support/resistance. After price breaks through these levels, the indicator
// automatically recalculates and sets new levels.
//
// Overshoot (1/8 and 7/8) - Orange color, dotted line
// Weak level. If price has moved too far and stops near this level, it will reverse
// quickly. If it doesn't stop, it will continue moving.
//
// SUP/RES (2/8 and 6/8) - Blue color, solid line
// Strongest support and resistance levels. Provide the strongest resistance and
// support. Key levels for trading.
//
// Stop & Reverse (3/8 and 5/8) - Yellow color, dotted line
// Weak level. If price has moved too far and stops near this level, it will reverse
// quickly in the opposite direction.
//
// PIVOT (4/8) - Purple color, solid line
// Main support/resistance level. Provides the strongest resistance/support. This is
// the best level for new buy or sell entries.
//
// HOW TO USE:
//
// 1. SETTINGS:
// - Enable/disable desired timeframes (Daily, Weekly, Monthly)
// - Enable level labels for easy identification
// - Adjust line thickness to your preference
//
// 2. TRADING:
// - PIVOT (4/8) - main level for position entry
// - SUP/RES (2/8, 6/8) - strong levels for placing stop-losses and take-profits
// - Extreme Overshoot (0/8, 8/8) - levels for identifying trend reversal
// - Use combination of levels from different timeframes to confirm signals
//
// 3. INTERPRETATION:
// - Price above PIVOT - potentially bullish trend
// - Price below PIVOT - potentially bearish trend
// - Bounce from SUP/RES levels - strong signal for entry
// - Breakthrough of Extreme Overshoot - possible trend change
//
// ADVANTAGES:
// - High accuracy in determining support and resistance levels
// - Multi-timeframe analysis for better understanding of the overall picture
// - Automatic recalculation when market conditions change
// - Visual indication of level strength
// - Easy to use and interpret
//
// TECHNICAL DETAILS:
// - Calculation method based on Gann theory and Murray mathematics
// - Octave is calculated as a power of two from the price range
// - Levels are divided into 8 equal parts (0/8 to 8/8)
// - Previous period data is used for calculation stability
//

EgyptTraderFx - Horus Opening RangeHorus Opening Range – EgyptTraderFx
Horus Opening Range marks configurable session ranges and highlights potential breakout opportunities based on pure price action.
Designed for traders who focus on timing, session behavior, and market structure, this indicator helps identify key high-impact levels formed during important market openings such as London and New York.
🔹 Key Features
Custom session time & timezone
Automatic session high / low levels
Visual session range box
Clean breakout signals above or below the range
Alerts for session start, session end, and breakouts
Works across Forex, Indices, Metals, and Crypto
🔹 Best Use
Opening range strategies
Session-based trading (London / NY / Asia)
Scalping and intraday trading
High-liquidity market conditions
⚠️ Notes
This indicator is a technical tool, not a trading system.
Risk management and trade confirmation remain the trader’s responsibility.
BBMA Signal ProBBMA Signal Pro
BBMA Signal Pro is a professional BBMA (Bollinger Band + Moving Average) cycle indicator designed to identify structure, momentum, and continuation — not random signals.
This script strictly enforces the BBMA trading cycle and only allows continuation and re-entry signals when the market context is valid.
Core Components
Bollinger Bands (20 SMA, configurable)
WMA 5 & WMA 10 (High / Low)
EMA 50 for trend confirmation
BBMA Cycle Logic (Strict Flow)
All continuation setups require the full BBMA sequence to complete:
EXT (Extreme)
TPW (TP Wajib)
MHV (Market Hilang Volume)
Only after this sequence is completed will continuation setups be allowed.
This prevents early, unstructured, and low-quality signals.
Signals Included
EXT – MA pushes outside Bollinger Band
TPW – price reacts to opposite MA5 after EXT
MHV – price fails to break Bollinger Band
CSAK – continuation candle inside BB zone
CSM – strong momentum candle closing fully outside BB
Re-Entry – controlled pullback after CSAK or CSM
Each CSAK / CSM setup:
Appears only once
Waits for re-entry or invalidation
Is canceled immediately by an opposite CSAK or CSM
Re-Entry Conditions
Pullback to MA5 High (Sell) or MA5 Low (Buy)
Default Trend Confirmation (IMPORTANT)
By default, Re-Entry uses the CURRENT timeframe trend as confirmation:
Sell Re-Entry → Mid BB below EMA50
Buy Re-Entry → Mid BB above EMA50
This prevents:
Counter-trend re-entries
Late or forced continuation trades
Chasing exhausted moves
Optional entry confirmation:
-Touch MA5 only
-Touch MA5 + close inside MA5 band
Valid within 10 candles after the setup
Must match the last active setup (CSAK or CSM)
Dynamic Multi-Timeframe Trend Confirmation
Trend confirmation adapts automatically to the chart timeframe:
Chart TF | Trend Confirmation
5m | M15 + H1
15m | H1 + H4
1H | H4
4H | Daily
Daily | Current TF
Used for:
Filtering CSAK / CSM setups
Optional Re-Entry confirmation
Visual trend tables
Alerts
Trend Filter Modes
You control how strict the trend filtering is:
-No Filter
-Higher TF Only
-Current TF Only
-Higher TF + Current TF
A Skip Current TF Check option is available for advanced users who want earlier signals before full confirmation.
Invalidation Rules
Any opposite CSAK or CSM immediately cancels all pending setups and re-entries
Prevents holding bias when market structure flips
Visual & UX Features
Clean BB + MA layout (matches BBMA Signal Pro reference)
No duplicate labels
Clear setup → continuation → re-entry flow
Dynamic trend tables
-Higher timeframe trend table
-Current timeframe trend (Mid BB vs EMA50)
Alerts (Production-Ready)
Matches visual logic exactly
Supports webhook automation
Re-Entry alerts respect:
-Trend confirmation
-Re-Entry mode timing (touch vs close)
JSON payload includes:
Price
SL / TP reference
Trend context
Chart link
Who This Script Is For
✔ BBMA traders who follow structure
✔ Traders who respect trend alignment
✔ Traders who want re-entries done properly
✖ Not for scalping noise
✖ Not for counter-trend gambling
Final Note
This is not a signal spam indicator.
It is a decision-filtering system .
If you understand BBMA, this script enforces discipline.
If you don’t, it will expose impatience very quickly.
Trade the cycle. Follow the trend. Re-enter with confirmation.

EMA 20/50 + RSI Trend Strategy [Clean & Simple]### **Title: EMA 20/50 + RSI Trend Strategy **
**Description:**
This is a pure trend-following strategy designed for Crypto intraday trading. It combines **EMA Crossovers** (for trend direction) with **RSI** (for momentum confirmation) to filter out choppy markets and false signals.
**1. Core Logic**
The strategy only signals an entry when both the Trend and Momentum are aligned:
* **Trend Filter:** Uses EMA 20 and EMA 50.
* **Momentum Filter:** Uses RSI (Length 14) with a baseline of 50.
**2. Signal Conditions**
* **🟢 LONG Signal:**
* Price Trend: EMA 20 is **ABOVE** EMA 50.
* Momentum: RSI is **ABOVE** 50.
* **🔴 SHORT Signal:**
* Price Trend: EMA 20 is **BELOW** EMA 50.
* Momentum: RSI is **BELOW** 50.
**3. Visual Features**
* **Bar Coloring:**
* **Green Bars:** Strong Bullish Trend (Long conditions met).
* **Red Bars:** Strong Bearish Trend (Short conditions met).
* **Gray Bars:** Neutral/Choppy Market (Stay aside).
* **Labels:** "LONG" and "SHORT" labels appear on the chart when the market state changes.
**4. Recommended Usage**
* **Timeframe:** Works best on **15m** (Scalping) or **1H** (Day Trading).
* **Assets:** High volatility pairs like BTCUSDT, ETHUSDT, SOLUSDT.
* **Strategy Tip:** Do not enter blindly on every signal. Wait for a pullback to the EMA 20/50 lines while the bar color remains Green/Red for the highest win rate.
**5. Alerts**
* This script supports TradingView alerts. You can set up alerts for "LONG Signal" and "SHORT Signal" in the alert menu.

Murray Math MTF + EMA + ZigZag ABCD + SignalsThis indicator combines multiple technical analysis tools:
1. EXPONENTIAL MOVING AVERAGES (EMAs)
- EMA 144 (blue line): Long-term trend filter
- EMA 72 (green line): Medium-term trend filter
2. ABCD ZIGZAG PATTERN
- Identifies pivot highs and lows to form ABCD patterns
- Draws pink lines connecting pivot points
- Configurable pivot detection (left/right bars)
3. BUY/SELL SIGNALS
- BUY Signal (green triangle ▲): Triggers when a pivot low forms after a
bearish trend (bullish reversal pattern)
- SELL Signal (red triangle ▼): Triggers when a pivot high forms after a
bullish trend (bearish reversal pattern)
- Signals appear at pivot points with triangles pointing to candles
USAGE:
- Use EMA 144 as a trend filter (price above = bullish, below = bearish)
- Look for ABCD patterns to identify potential reversal points
- Trade in the direction of signals when they align with trend
- Buy signals appear below candles, Sell signals appear at pivot highs
SETTINGS:
- Pivot Left Length: Number of bars to look left for pivot confirmation
- Pivot Right Length: Number of bars to look right for pivot confirmation
- Show ZigZag Lines: Toggle to show/hide pink ABCD pattern lines

IDS - Institutional Dip Sniper在加密貨幣市場中,70% 的時間都處於震盪或回調。當大多數突破策略(Breakout Strategies)因為假突破而虧損時,IDS (Institutional Dip Sniper) 卻能從恐慌中獲利。
核心邏輯:
均值回歸 (Mean Reversion): 我們不追高,我們專注於捕捉價格短期過度偏離均線的時刻(Oversold)。這是數學上勝率最高的交易方式之一。
機構安全氣囊: 並非所有的下跌都能接。本策略內建 Coinbase 機構資金濾網,只有在確認機構大戶仍在場內時,才會執行抄底,大幅降低「接到下跌趨勢」的風險。
極速進出: 持倉時間極短,捕捉反彈即離場,有效避開市場長期的不確定性。
適用環境: 牛市回調、震盪盤整(Monkey Market)。
In the crypto market, assets range or correct 70% of the time. While most trend-following/breakout strategies bleed out during these periods, IDS (Institutional Dip Sniper) thrives by capitalizing on short-term panic.
Core Logic:
Mean Reversion: We don't chase green candles. We mathematically identify moments when the price is statistically oversold. This approach historically offers a higher win rate than trend following.
Institutional Safety Net: Not all dips are buyable. This system integrates a proprietary Coinbase Institutional Flow Filter. It only executes mean reversion trades when institutional accumulation is detected, preventing "catching a falling knife" in a bear trend.
High Velocity: Short holding periods. The strategy captures the snap-back bounce and exits immediately, reducing exposure to market volatility.
Ideal Conditions: Bull market pullbacks, Choppy/Ranging markets.
免責聲明 (Disclaimer)
補充說明: 以上策略績效源自歷史數據回測,不代表對未來獲利的保證。加密貨幣市場風險極高,本策略僅供量化研究與邏輯分享,使用者應自行評估風險並自負盈虧,本人不承擔任何交易損失。
Disclaimer: The performance above is based on historical backtesting and does not guarantee future results. Cryptocurrency trading involves high risk. This strategy is shared for quantitative research and educational purposes only. Users are solely responsible for their own risk assessment and PnL. I assume no liability for any trading losses incurred.

MASTER MACD'S Plus2nd Indicator- Description to come later... Invite only Go to the indicator then invite only. Click invite only and it should show up under my scripts. Save as a favorite and in settings click checkboxes Enable Ghost MacD MOdule, Show Histograms, Show Zero Line, Show Adaptive Zero Buff, Show engage Labels, Show RSI Zones, , and Smooth RSI. I will provide a better description later.
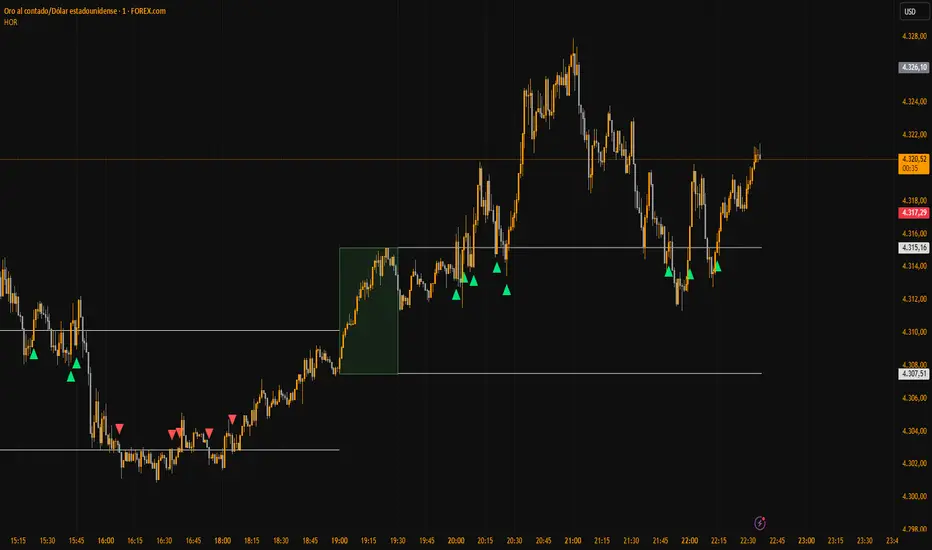
Clean Market Structure & Trend Confirmation ( Updated ) CLEAN MARKET STRUCTURE & TREND CONFIRMATION — 24H CONTINUATION EDITION
This indicator is designed to help traders identify clear market direction, confirm trend strength, and manage trades with structured take-profit and stop levels. It works by aligning trend, momentum, and structure before showing any BUY or SELL signal. Signals are selective by design to reduce noise and false entries.
This version includes an optional continuation mode, allowing additional high-quality signals when trends persist, while still maintaining discipline and structure.
HOW TO LOAD AND USE (IMPORTANT)
Add the indicator to your chart.
Recommended symbols: SPY, QQQ, ES1!, NQ1! (works on stocks and futures).
Recommended timeframes:
• 5-minute (default and most balanced)
• 1-minute (faster, more active, optional)
No refresh is required each day. The script resets automatically.
RECOMMENDED DEFAULT SETTINGS
• 9:25 Bias Filter: ON
• Continuation Signals: ON
• TP Ladder: ON
• Keep Only Most Recent TP Ladder: ON
• Execute on Candle Close: optional (ON = safer, OFF = faster)
These defaults provide the best balance between discipline and opportunity.
HOW THE RIBBON WORKS (CORE TREND FILTER)
The ribbon is the foundation of the system.
• Teal ribbon = bullish trend
• Red ribbon = bearish trend
• Gray ribbon = no-trade zone
The system avoids signals in gray conditions to reduce chop. Only trade in the direction of the ribbon.
BULL AND BEAR DOTS
Bull and Bear dots mark confirmed trend flips.
• Bull dot = trend has flipped bullish
• Bear dot = trend has flipped bearish
These are not trades by themselves. They are early awareness signals that help you prepare for potential entries.
BUY AND SELL ARROWS (TRADE SIGNALS)
BUY and SELL arrows appear only when:
• Ribbon direction is aligned
• Trend structure confirms
• Momentum and volume agree
• Market conditions are favorable
These arrows represent high-probability trade opportunities, not constant signals.
TAKE PROFIT & STOP LEVELS
When a BUY or SELL arrow prints:
• TP1, TP2, TP3 levels appear automatically
• A STOP level is plotted automatically
• Levels are based on volatility and adjust to market conditions
Only the most recent trade plan is shown to keep the chart clean.
CONTINUATION MODE (WHAT’S DIFFERENT)
Compared to the original version:
• This version can take more than one trade per day
• It allows new trades when trends reset and realign
• It does NOT chase every candle
• It still requires full confirmation before each signal
Think of this as adaptive trend participation, not aggressive scalping.
1-MINUTE VS 5-MINUTE USE
• 5-minute: fewer signals, higher confidence, best for most users
• 1-minute: earlier entries, more activity, requires discipline
You do NOT need to switch back and forth constantly. Pick one timeframe and stay consistent.
IMPORTANT NOTES FOR NEW USERS
• Fewer signals is a feature, not a flaw
• Missing a move is better than forcing a bad trade
• Always manage risk and position size
• This indicator assists decision-making — it does not predict the future
DISCLAIMER
This indicator is for educational purposes only. It is not financial advice. Trading involves risk, and you are responsible for all trading decisions. Use proper risk management and only trade with capital you can afford to lose.
