smolka Bayesian Volatile ChannelDescription in English and Russian.
Bayesian Volatile Channel
The script is a loose interpretation of Bayes' theorem, which allows calculating the probability of events given that another event related to it has occurred, the script analyzes volatility and detects anomalies in price charts using a Bayesian approach, updating the model parameters to accurately estimate market fluctuations and detect changes in trends.
How does it work?
1. The script sets the initial parameters (mean price and standard deviation), creating a "hypothesis" about the market behavior.
2. When a new price appears, the script calculates the probability of its compliance with previous expectations. If the new price differs from the forecast, the model parameters (mean and standard deviation) are updated.
3. After updating the model, the probability that the current price and volatility correspond to a normal distribution is calculated.
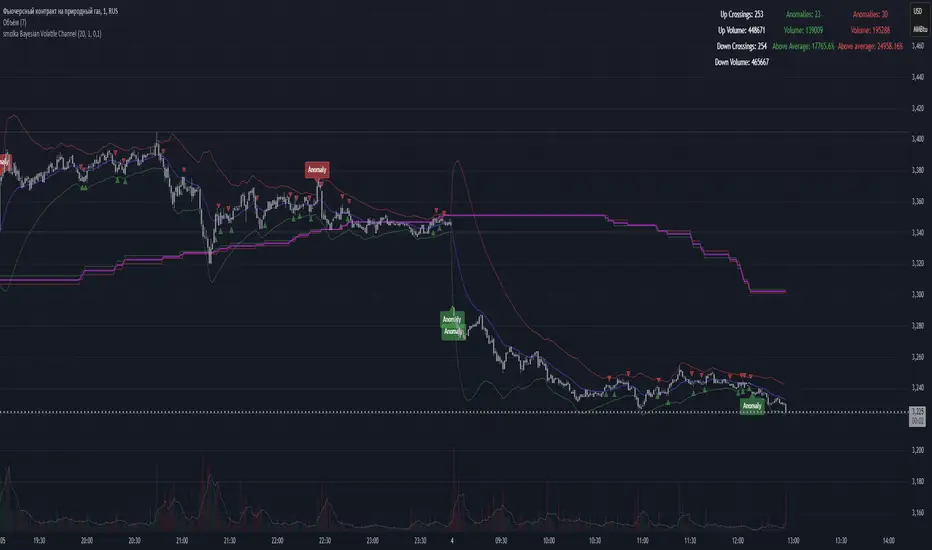
4. Based on the updated model, volatility channels are built (mean price ± two standard deviations). If the price goes beyond these limits, this signals a possible anomaly indicating changes in the market.
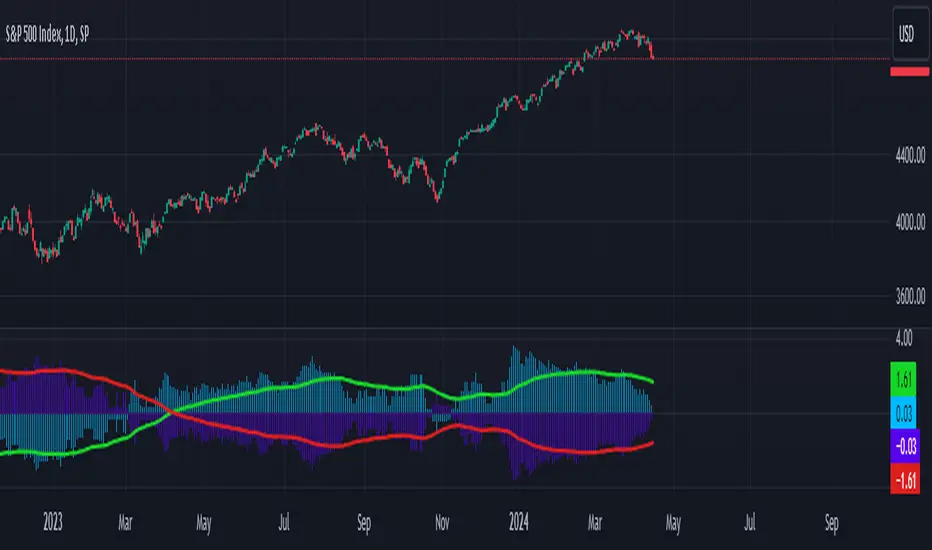
5. The moving averages in the script act as data smoothing and trend analysis, helping to identify the market direction and minimize the impact of random fluctuations. The script uses moving averages to identify uptrends and downtrends, and calculates the average between them to display the overall market balance. These moving averages make market analysis clearer and more resistant to short-term fluctuations.
******************************************************************
Описание на английском и русском языках.
Байесовский волатильный канал
Скрипт является вольной интерпретацией теоремы Байеса, которая позволяет расчитать вероятность событий при условии, что произошло связанное с ним другое событие, скрипт анализирует волатильность и обнаруживает аномалии в графиках цен, используя байесовский подход, обновляя параметры модели для точной оценки рыночных колебаний и обнаружения изменений в тенденциях.
Как это работает?
1. Скрипт устанавливает начальные параметры (среднюю цену и стандартное отклонение), создавая "гипотезу" о поведении рынка.
2. При появлении новой цены скрипт вычисляет вероятность её соответствия предыдущим ожиданиям. Если новая цена отличается от прогноза, параметры модели (среднее и стандартное отклонение) обновляются.
3. После обновления модели рассчитывается вероятность того, что текущая цена и волатильность соответствуют нормальному распределению.
4. На основе обновлённой модели строятся каналы волатильности (средняя цена ± два стандартных отклонения). Если цена выходит за эти пределы, это сигнализирует о возможной аномалии, указывающей на изменения на рынке.
5. Средние скользящие в скрипте выполняют роль сглаживания данных и анализа трендов, помогая выявить направление рынка и минимизировать влияние случайных колебаний. Скрипт использует скользящие средние для определения восходящего и нисходящего трендов, а также рассчитывает среднее значение между ними для отображения общего баланса рынка. Эти скользящие средние делают анализ рынка более чётким и устойчивым к краткосрочным флуктуациям.
Pine Script®指标