Overbought/Oversold Simple Overbought/Oversold indicator
You can change long to short in the Input Settings
WARNING:
- For purpose educate only
- This script to change bars colors.
Overbought
Overbought/Oversold Simple Overbought/Oversold indicator
WARNING:
This script to change bars colors.

Colored Williams %RThis script is the same as Williams %R except that on green days we plot green and red on red days. If a bar opens and closes the same, we plot black.

Number Indicatorbased on indicator created by coinsheet.org created by autemox
tells you when 9 candles in a row are green or red candles (this indicates price may be oversold or overbought)

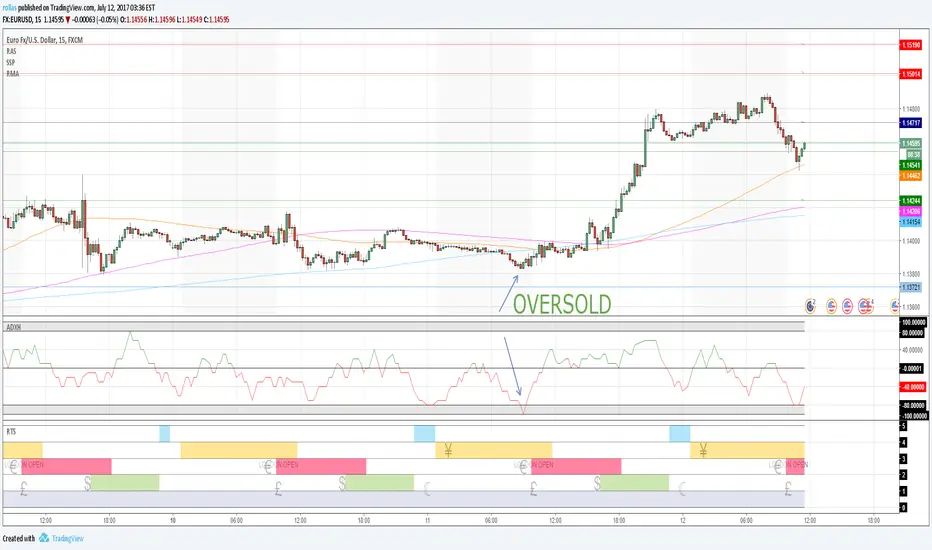
HYPER ADXADX typically shows the strength of a trend. Hyper ADX is specially coded for showing intraday overbought and oversold conditions.
Stochastic with False bar R2-2 by JustUncleLThis study project is an updated version of the implementation of the "Stochastic False BAR" indicator.
Description:
The standard Stochastic buy/sell indications come from Stochastic crosses about the standard overbought/oversold zones (80/20). This does not always work and you get stuck in the OB/OS zones with a trend continuation. Utilising a second much longer length Stochastic, the "False BAR" (Black) indicates when it is unsafe to take Stochastic cross over trades. Where the false bar does not appear (aqua, no background highlighing), the overbought / oversold conditions of the Stochastic can be considered higher-probability reversal areas and thus trading opportunities.
This Revision:
Added options to enable/disable False Bar lines and Stochastic trends.
Added options to modify upper and lower limits of false bar Stochastic and trading stochastic trend.
Added option to show the trading Stochastic as coloured Ribbon.
Added name titles for all plots
Added Background highlighting for False Bar.

B3 Stochastic FullA colorful take on the classic stochastic indicator, coded from scratch. Enjoy! :)

B3 Directional Trend IndexB3 Directional Trend Index ~ All about the trend! William Blau is the designer of this gem, and IMHO it is the best trend finder of all the lagging indicators out there I have tested. It is important to pay attention to the slope and thickness of the line, and its relationship to zero. A reversion to the zero may look momentous, but in fact it could reverse when it reaches mean, only to turn back around. You can see this in March and April of this silver futures daily chart. Makes for a great instrument on anything you consider trendy, like crude oil for example. The default user inputs are set to my liking, as I find them to be great on all charts and resolutions. You may read around to find more about this on the internet, or its mentioned in Krausz's work. Also, imprtant to remember when no trend, trend finders like this sufffer, so be wise as to what market condition you are in. Rangy and within Range = no, On the Move = yes.

Stochastic Momentum IndexThis is an implementation of the Stochastic Momentum Index from William Blau's his article in Stocks & Commodities .
This also allows the use of various different kinds of moving averages for the signal line. Options for this argument are:
sma (simple moving average)
ema (exponential moving average)
wma (weighted moving average)
trima (triangular moving average)
zlema (zero-lag exponential moving average)
dema (double exponential moving average)
tema (triple exponential moving average)
hma (hull moving average)
MACD + RSI TSA simple strategy that use EMAs convergence/divergence and RSI peeks to take position. Fractals are really useful to positioning your stop loss.
It works well on commodities and forex markets.

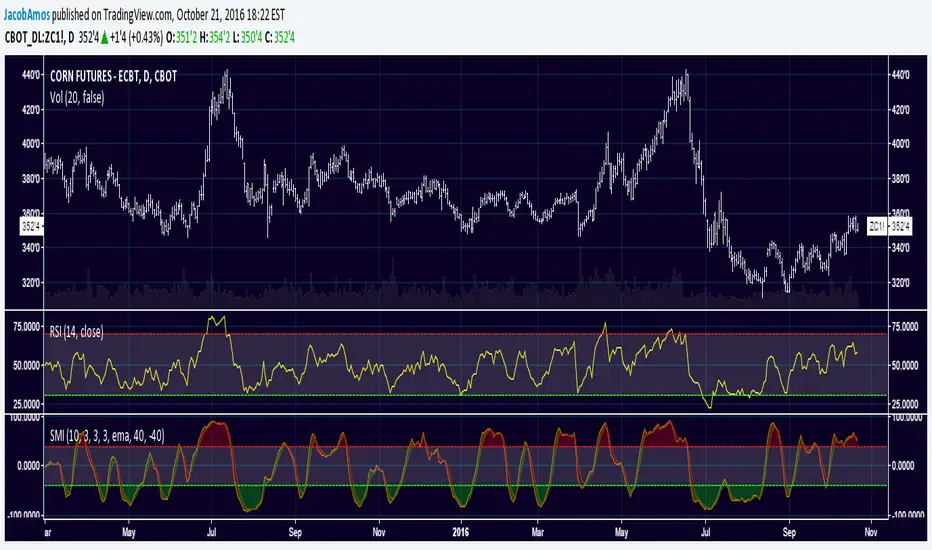
Stochastic Momentum Index (SMI)Stochastic Momentum Index (SMI) or Stoch MTM is used to find oversold and overbought zones. It also helps to figureout whether to enter short trade or long trade.
Red Shade in the Top indicates that the stock is oversold and the Green shade in the bottom indicates overbought.
Strategy:
Enter Long once the Overbought Zone ended and there's a crossover below -35.
Exit Long once the oversold zone is ended and there's a crossover.
Enter Short once the oversold zone is ended and there's a crossover above 35.
Exit Short once the Overbought Zone ended and there's a crossover.
Backup: Always use with another indicator because there will be multiple up and down movement in one Trend.

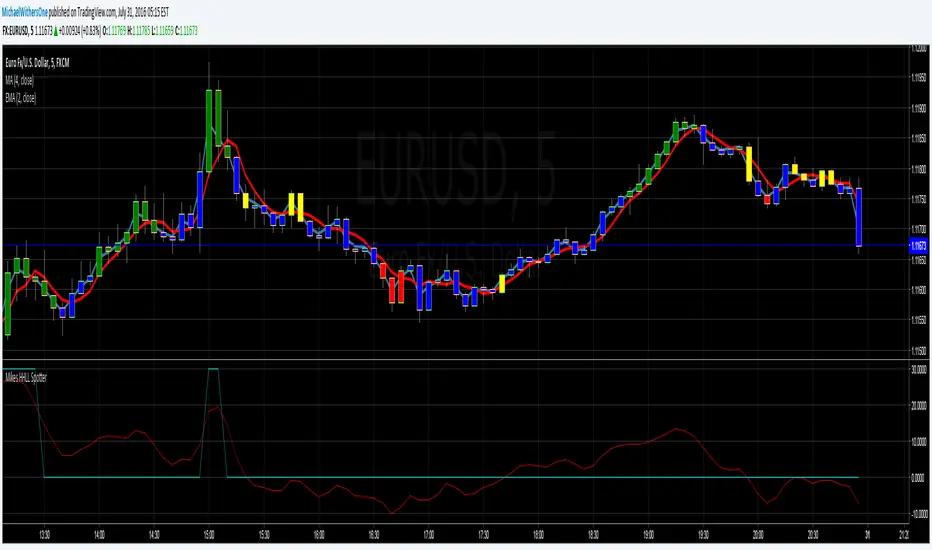
Mikes 5 min HHLL SpotterAttempts to find higher highs and lower lows in the 5 minute window. When the light blue graph line peaks , you should investigate selling , when the light blue graph line dips you should investigate buying.
This is good for identifying oversold and over bought positions
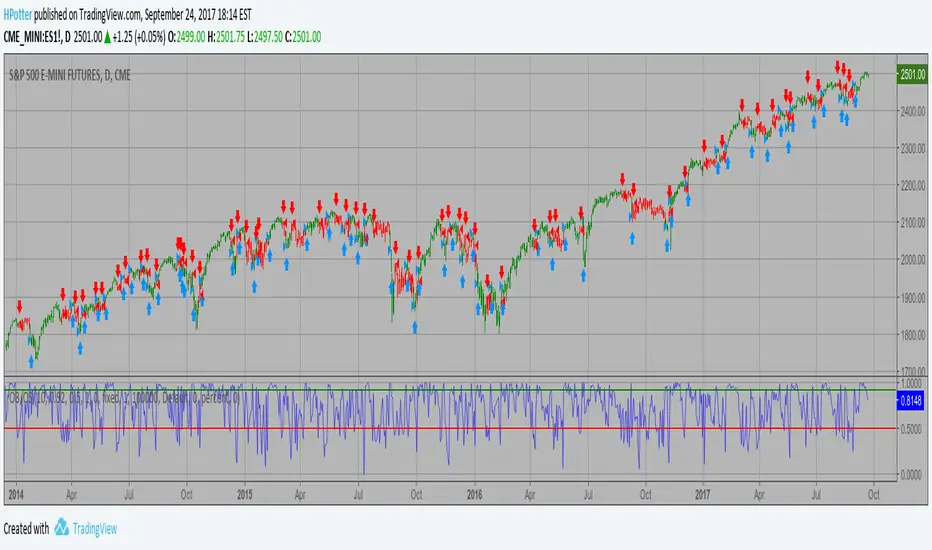
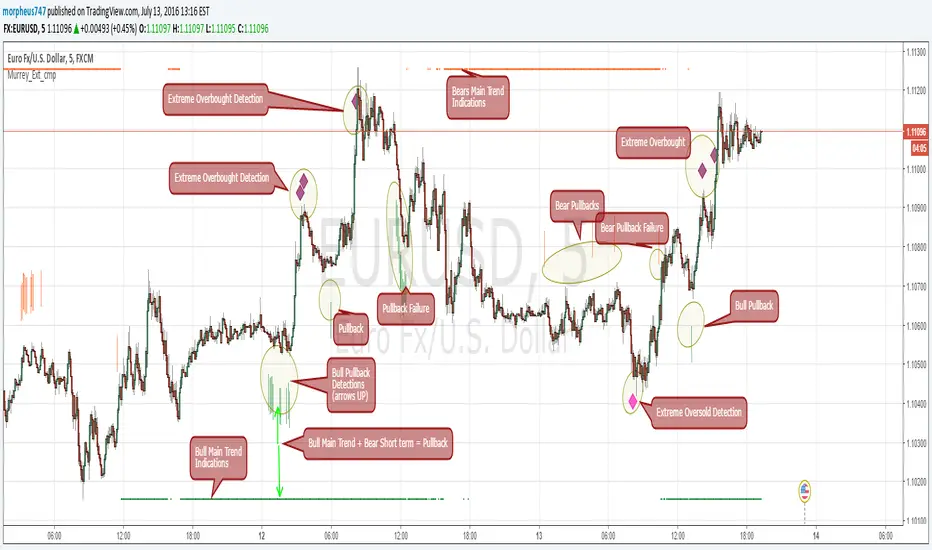
Murrey Math Extremes ComparatorHOW IT WORKS
Creates two murrey math oscillators (hidden) one with 256 length another with 32 length and compare each other.
WHAT GIVE ME THIS SCRIPT
The script can give you very valuable information:
- Main Trend
- Pullbacks detections
- Extreme overbought oversold prices alerts
- Divergences
- Any timeframe usage
REFERENCES OF USAGE
Main Trend Indications
****The main trend is indicated with green(bull) or red(bears) small "triangles" on the bottom(bull) or the top(bears) of the chart.
*****To detect the Bull/Bear major trend the script use 256 murrey, if > 0 (green) we are uptrend in other cases we are downtrend
Pullback detection
****The pullbacks are indicated with Green(bull) or red(bears) medium "Arrows"
*****To detect pullbacks the system compare the long term murrey with the short term murrey, if long term is Green(green triangles)
*****so we are in a main bull trend, if the short term murrey make an extreme low then the pullback is indicated
*****The same for the short pullback, if long term murrey is RED and we have an extreme green short term murrey we shot a red arrow
Extreme Overbught/Oversold
****The extreme OO is indicated with fancy diamonds
*****To detect the Extremes price movements we combine the two murrey, if Long Term Murrey is overbought and short term murrey too
*****Then the diamond show on the screen obove or below based on the extreme if overbought or oversold
Strategy Resume:
Triangles indicate Major Trend Up/Down
Arrows Indicate Continuation pullbacks
Diamonds Indicate Extreme Prices
GUIDE HOW TO IMAGES
How it's works Behind Scene
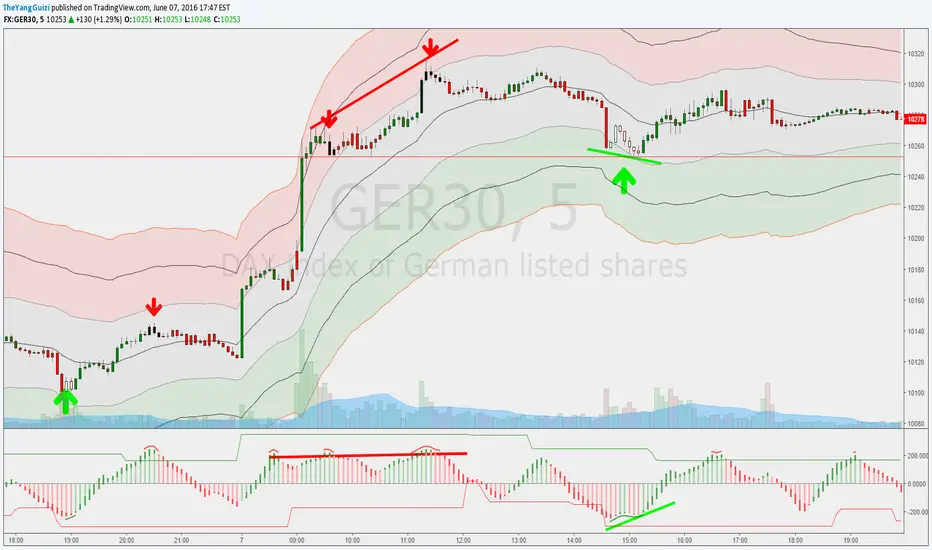
Matrix ModThis is the Matrix oscillator made by glaz. So credit goes to him.
I made some minor modifications to it:
1. added a zeroline
2. added 3 options to color bars/candles depending on:
- if the oscillator is above/below 0
- if it's oversold/bought*
- if the matrix has a green bar or a red
That's all :)
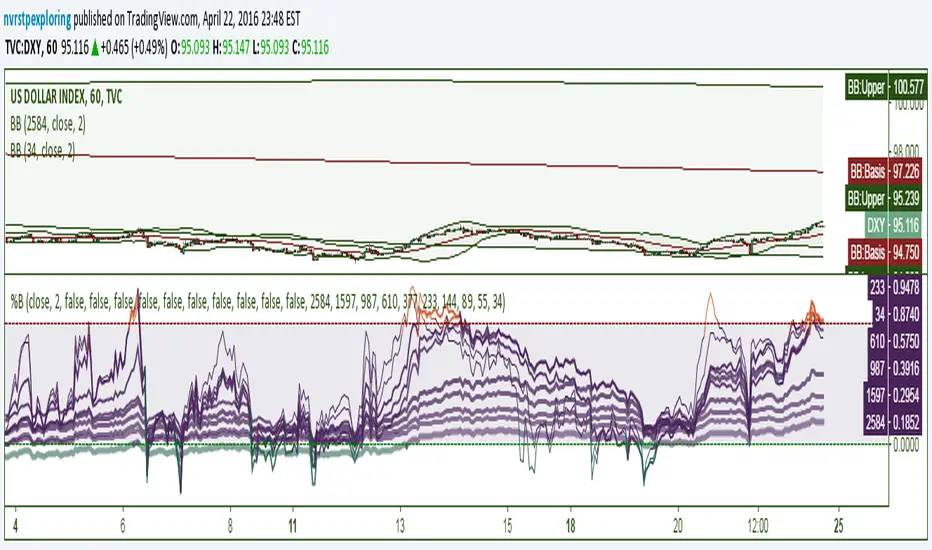
%BsAn indicator with 10 configurable %B lines for identifying trends, overbought and oversold conditions, and reversal points. %B is a linear representation of a securities relationship to the Upper and Lower Bollinger Bands. The best opportunities arise when a security is oversold in a bullish trend and overbought in a bearish trend. The longer %B trend-lines in this indicator are very useful for major reversals. They can be used to indicate the high or low of the day on a 1-minute chart or show a multi-year reversal point.
%B = (Current Price - Lower Band) / (Upper Band - Lower Band)
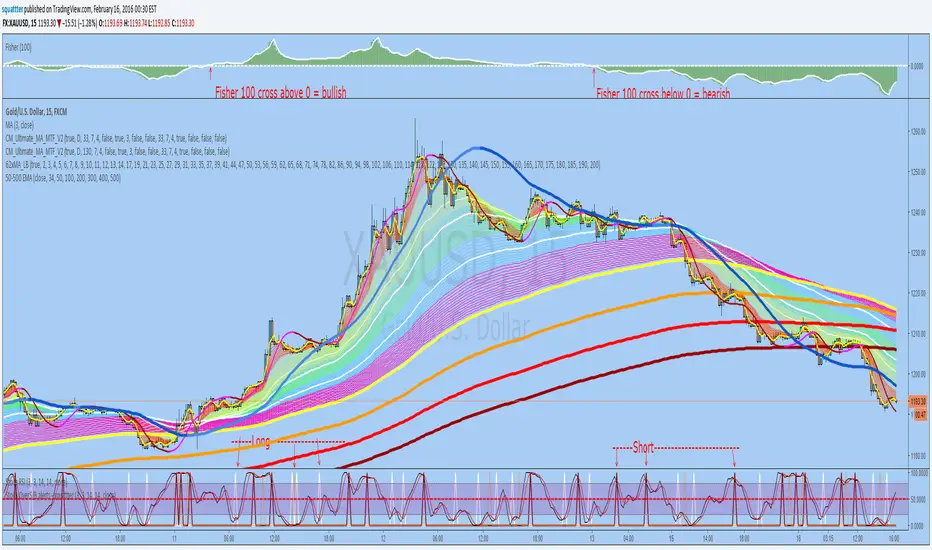
StochRSI overSold/Bought alerts - by squattterDepending on the new trend - Fisher 100 crossing 0;
Set an alert on each Long/Short "crossing down", 0.8 (or anything below 0.99), "on condition"
MAGNUS™A CHANGE of background color indicates a trade opportunity :
Cyan background = BUY
Purple background = SELL
The bullish signals seem to be better than the bearish ones.
Based on the "Willy" indicator.
Don't change the parameters unless you fully understand the consequences.
Use with brains and caution :)

UCS_Momentum Oscillator - Version 2This is Version - 2 of the Momentum Oscillator, Like i said on the prior version, This version has an Indicator for Trends.
Marks only Overbought and Oversold Based on the TREND.
The Trend dots are calculated exactly like the Slingshot system trend.

UCS_Value BandsThis Indicator is yet another variation of KC. Inspired from Value Charts webinar. I have seen their videos on youtube. What appears to be a variation of KC.
They use 12 bands Showing the zone, and different MA for different timeframes.
You can get this indicator close to accuracy by changing the inputs (ATR) and (Deviations)
This also can be used with the triple ATR setup - Change the values to EMA to desired value. To obtain the First band to plot @ 1, Change the Band deviation to 0.25.
Also can be used as as the Acceleration Band. With Current Settings, the Third Band will plot the Acceleration band.
List of All my Indicators - www.tradingview.com
Lycka Till
