saodisengxiaoyu-lianghua-2.1- This indicator is a modular, signal-building framework designed to generate long and short signals by combining a chosen leading indicator with selectable confirmation filters. It runs on Pine Script version 5, overlays directly on price, and is built to be highly configurable so traders can tailor the signal logic to their market, timeframe, and trading style. It includes a dashboard to visualize which conditions are active and whether they validate a signal, and it outputs clear buy/sell labels and alert conditions so you can automate or monitor trades with confidence.
Core Design
- Leading Indicator: You choose one primary signal generator from a broad list (for example, Range Filter, Supertrend, MACD, RSI, Ichimoku, and many others). This serves as the anchor of the system and determines when a preliminary long or short setup exists.
- Confirmation Filters: You can enable additional filters that validate the leading signal before it becomes actionable. Each “respect…” input toggles a filter on or off. These filters include popular tools like EMA, 2/3 EMA crosses, RQK (Nadaraya Watson), ADX/DMI, Bollinger-based oscillators, MACD variations, QQE, Hull, VWAP, Choppiness Index, Damiani Volatility, and more.
- Signal Expiry: To avoid waiting indefinitely for confirmations, the indicator counts how many consecutive bars the leading condition holds. If confirmations do not align within a defined number of bars, the setup expires. This controls latency and helps reduce late or stale entries.
- Alternating Signals: An optional mode enforces alternation (long must follow short and vice versa), helping avoid repeated entries in the same direction without a meaningful reset.
- Aggregation Logic: The final long/short conditions are formed by combining the leading condition with all selected confirmation filters through logical conjunction. Only if all enabled filters validate the signal (within expiry constraints) does the indicator consider it a confirmed long or short.
- Visualization and Alerts: The script plots buy/sell labels at signal points, provides alert conditions for automation, and displays a compact dashboard summarizing the leading indicator’s status and each confirmation’s pass/fail result using checkmarks.
Leading Indicator Options
- The indicator includes a very large menu of leading tools, each with its own logic to determine uptrend or downtrend impulses. Highlights include:
- Range Filter: Uses a dynamic centerline and bands computed via conditional EMA/SMA and range sizing to define directional movement. It can operate in a default mode or an alternative “DW” mode.
- Rational Quadratic Kernel (RQK): Applies a kernel smoothing model (Nadaraya Watson) to detect uptrends and downtrends with a focus on noise reduction.
- Supertrend, Half Trend, SSL Channel: Classic trend-following tools that derive direction from ATR-based bands or moving average channels.
- Ichimoku Cloud and SuperIchi: Multi-component systems validating trend via cloud position, conversion/base line relationships, projected cloud, and lagging span.
- TSI (True Strength Index), DPO (Detrended Price Oscillator), AO (Awesome Oscillator), MACD, STC (Schaff Trend Cycle), QQE Mod: Momentum and cycle tools that parse direction from crossovers, zero-line behavior, and momentum shifts.
- Donchian Trend Ribbon, Chandelier Exit: Trend and exit tools that can validate breakouts or sustained trend strength.
- ADX/DMI: Measures trend strength and directional movement via +DI/-DI relationships and minimum ADX thresholds.
- RSI and Stochastic: Use crossovers, level exits, or threshold filters to gate entries based on overbought/oversold dynamics or relative strength trends.
- Vortex, Chaikin Money Flow, VWAP, Bull Bear Power, ROC, Wolfpack Id, Hull Suite: A diverse set of directional, momentum, and volume-based indicators to suit different markets and styles.
- Trendline Breakout and Range Detector: Price-behavior filters that confirm signals during breakouts or within defined ranges.
Confirmation Filters
- Each filter is optional. When enabled, it must validate the leading condition for a signal to pass. Examples:
- EMA Filter: Requires price to be above a specified EMA for longs and below for shorts, filtering signals that contradict broader trend or baseline levels.
- 2 EMA Cross and 3 EMA Cross: Enforce moving average cross conditions (fast above slow for long, the reverse for short) or a three-line stacking logic for more stringent trend alignment.
- RQK, Supertrend, Half Trend, Donchian, QQE, Hull, MACD (crossover vs. zero-line), AO (zero line or AC momentum variants), SSL: Each adds its characteristic validation pattern.
- RSI family (MA cross, exits OB/OS zones, threshold levels) plus RSI MA direction and RSI/RSI MA limits: Multiple ways to constrain signals via relative strength behavior and trajectories.
- Choppiness Index and Damiani Volatility: Prevent entries during ranging conditions or insufficient volatility; choppiness thresholds and volatility states gate the trade.
- VWAP, Volume modes (above MA, simple up/down, delta), Chaikin Money Flow: Volume and flow conditions that ensure signals happen in supportive liquidity or accumulation/distribution contexts.
- ADX/DMI thresholds: Demand a minimum trend strength and directional DI alignment to reduce whipsaw trades.
- Trendline Breakout and Range Detector: Confirm that the price is breaking structure or remains within active range consistent with the leading setup.
- By combining several filters you can create strict, conservative entries or looser setups depending on your goals.
Range Filter Engine
- A core building block, the Range Filter uses conditional EMA and SMA functions to compute adaptive bands around a dynamic centerline. It supports two types:
- Type 1: The centerline updates when price exceeds the band thresholds; bands define acceptable drift ranges.
- Type 2: Uses quantized steps (via floor operations) relative to the previous centerline to handle larger moves in discrete increments.
- The engine offers smoothing for range values using a secondary EMA and can switch between raw and averaged outputs. Its hi/lo bands and centerline compose a corridor that defines directional movement and potential breakout confirmation.
Signal Construction
- The script computes:
- leadinglongcond and leadingshortcond : The primary directional signals from the chosen leading indicator.
- longCond and shortCond : Final signals formed by combining the leading conditions with all enabled confirmations. Each confirmation contributes a boolean gate. If a filter is disabled, it contributes a neutral pass-through, keeping the logic intact without enforcing that condition.
- Expiry Logic: The code counts consecutive bars where the leading condition remains true. If confirmations do not line up within the user-defined “Signal Expiry Candle Count,” the setup is abandoned and the signal does not trigger.
- Alternation: An optional state ensures that long and short signals alternate. This can reduce repeated entries in the same direction without a clear reset.
- Finally, longCondition and shortCondition represent the actionable signals after expiry and alternation logic. These drive the label plotting and alert conditions.
Visualization
- Buy and Sell Labels: When longCondition or shortCondition confirm, the script plots annotated labels directly on the chart, making entries easy to see at a glance. The labels use color coding and clear text tags (“long” vs. “short”).
- Dashboard: A table summarizes the status of the leading indicator and all confirmations. Each row shows the indicator label and whether it passed (✔️) or failed (❌) on the current bar. This intensely practical UI helps you diagnose why a signal did or did not trigger, empowering faster strategy iteration and parameter tuning.
- Failed Confirmation Markers: If a setup expires (count exceeds the limit) and confirmations failed to align, the script can mark the chart with a small label and provide a tooltip listing which confirmations did not pass. It’s a helpful audit trail to understand missed trades or prevent “chasing” invalid signals.
- Data Window Values: The script outputs signal states to the data window, which can be useful for debugging or building composite conditions in multi-indicator templates.
Inputs and Parameters
- You control the indicator from a comprehensive input panel:
- Setup: Signal expiry count, whether to enforce alternating signals, and whether to display labels and the dashboard (including position and size).
- Leading Indicator: Choose the primary signal generator from the large list.
- Per-Filter Toggles: For each confirmation, a respect... toggle enables or disables it. Many include sub-options (like MACD type, Stochastic mode, RSI mode, ADX variants, thresholds for choppiness/volatility, etc.) to fine-tune behavior.
- Range Filter Settings: Choose type and behavior; select default vs. DW mode and smoothing. The underlying functions adjust band sizes using ATR, average change, standard deviation, or user-defined scales.
- Because everything is customizable, you can adapt the indicator to different assets, volatility regimes, and timeframes.
Alerts and Automation
- The script defines alert conditions tied to longCondition and shortCondition . You can set these alerts in your chart to trigger notifications or webhook calls for automated execution in external bots. The alert text is simple, and you can configure your own message template when creating alerts in the chart, including JSON payloads for algorithmic integration.
Typical Workflow
- Select a Leading Indicator aligned with your style. For trend following, Supertrend or SSL may be appropriate; for momentum, MACD or TSI; for range/trend-change detection, Range Filter, RQK, or Donchian.
- Add a few key Confirmation Filters that complement the leading signal. For example:
- Pair Supertrend with EMA Filter and RSI MA Direction to ensure trend alignment and positive momentum.
- Combine MACD Crossover with ADX/DMI and Volume Above MA to avoid signals in low-trend or low-liquidity conditions.
- Use RQK with Choppiness Index and Damiani Volatility to only act when the market is trending and volatile enough.
- Set a sensible Signal Expiry Candle Count. Shorter expiry keeps entries timely and reduces lag; longer expiry captures setups that mature slowly.
- Observe the Dashboard during live markets to see which filters pass or fail, then iterate. Tighten or loosen thresholds and filter combinations as needed.
- For automation, turn on alerts for the final conditions and use webhook payloads to notify your trading robot.
Strengths and Practical Notes
- Flexibility: The indicator is a toolkit rather than a single rigid model. It lets you test different combinations rapidly and visualize outcomes immediately.
- Clarity: Labels, dashboard, and failed-confirmation markers make it easy to audit behavior and refine settings without digging into code.
- Robustness: The expiry and alternation options add discipline, avoiding the temptation to enter late or repeatedly in one direction without a reset.
- Modular Design: The logical gates (“respect…”) make the behavior transparent: if a filter is on, it must pass; if it’s off, the signal ignores it. This keeps reasoning clean.
- Avoiding Overfitting: Because you can stack many filters, it’s tempting to over-constrain signals. Start simple (one leading indicator and one or two confirmations). Add complexity only if it demonstrably improves your edge across varied market regimes.
Limitations and Recommendations
- No single configuration is universally optimal. Markets change; tune filters for the instrument and timeframe you trade and revisit settings periodically.
- Trend filters can underperform in choppy markets; likewise, momentum filters can false-trigger in quiet periods. Consider using Choppiness Index or Damiani to gate signals by regime.
- Use expiry wisely. Too short may miss good setups that need a few bars to confirm; too long may cause late entries. Balance responsiveness and accuracy.
- Always consider risk management externally (position sizing, stops, profit targets). The indicator focuses on signal quality; combining it with robust trade management methods will improve results.
Example Configurations
- Trend-Following Setup:
- Leading: Supertrend uptrend for longs and downtrend for shorts.
- Confirmations: EMA Filter (price above 200 EMA for long, below for short), ADX/DMI (trend strength above threshold with +DI/-DI alignment), Volume Above MA.
- Expiry: 3–4 bars to keep entries timely.
- Result: Strong bias toward sustained moves while avoiding weak trends and thin liquidity.
- Mean-Reversion to Momentum Crossover:
- Leading: RSI exits from OB/OS zones (e.g., RSI leaves oversold for long and leaves overbought for short).
- Confirmations: 2 EMA Cross (fast crossing slow in the same direction), MACD zero-line behavior for added momentum validation.
- Expiry: 2–3 bars for responsive re-entry.
- Result: Captures momentum transitions after short-term extremes, with extra confirmation to reduce head-fakes.
- Range Breakout Focus:
- Leading: Range Filter Type 2 or Donchian Trend Ribbon to detect breakouts.
- Confirmations: Damiani Volatility (avoid low-volatility false breaks), Choppiness Index (prefer trend-ready states), ROC positive/negative threshold.
- Expiry: 1–3 bars to act on breakout windows.
- Result: Better alignment to breakout dynamics, gating trades by volatility and regime.
Conclusion
- This indicator is a comprehensive, configurable framework that merges a chosen leading signal with an array of corroborating filters, disciplined expiry handling, and intuitive visualization. It’s designed to help you build high-quality entry signals tailored to your approach, whether that’s trend-following, breakout trading, momentum capturing, or a hybrid. By surfacing pass/fail states in a dashboard and allowing alert-based automation, it bridges the gap between discretionary analysis and systematic execution. With sensible parameter tuning and thoughtful filter selection, it can serve as a robust backbone for signal generation across diverse instruments and timeframes.
在脚本中搜索"adx"

EMA inFusion Pro - Multiple SourcesEMA Fusion Pro: Dynamic Trend & Momentum Strategy with Three Exit Modes
EMA Fusion Pro is a highly customizable, multi-exit trend-following strategy designed for traders who value both precision and flexibility. By leveraging exponential moving averages (EMA), average directional index (ADX), and volume analysis, this strategy aims to capture trending market moves while offering three distinct exit modes for optimal risk management across varying market conditions.
Strategy Overview
This strategy systematically identifies potential entry points using a moving average crossover with highly configurable data sources (including price, volume, rate of change, or their Heikin Ashi versions) and filters signal quality with ADX trend strength and volume spikes. Each trade is managed with one of three advanced exit methodologies—reverse signal, ATR-based stop/take profit, or fixed percentage—giving you the control to adapt your risk profile to different market regimes.
Key Features
Customizable EMA Source: Calculate the core trend-filtering EMA from price (default), volume, rate of change, or their Heikin Ashi counterparts for unique market perspectives.
Trend Filter with ADX: Confirm entries only when the trend is strong, as measured by the user-adjustable ADX threshold.
Volume Spike Confirmation: Optional filter to only take trades with above-average volume activity, reducing false signals.
Three Exit Modes:
Reverse Signal: Exit trades when a new, opposite entry signal occurs.
ATR-Based Stop/Take Profit: Dynamic risk management using multiples of the average true range (ATR) for both take profit and stop loss.
Percent-Based Stop/Take Profit: Fixed-percentage risk management with user-defined thresholds.
Visual Annotations: Signal markers, EMA line color-coded by source, trend background coloring, and optional ATR/percent-based TP/SL levels.
Info Panel: Real-time display of all core indicators, current trading mode, exit parameters, and position status for quick oversight.
How It Works
Entry Logic: A crossover signal (above/below the EMA) triggers a new entry, but only if both ADX trend strength and (optionally) volume spike conditions are met.
Exit Logic: Three selectable modes allow you to exit trades on reverse signals, at a dynamic ATR-based profit or loss, or at a fixed percentage gain/loss.
Flexible Data Analysis: The EMA source can be chosen from six options—standard price, volume, rate of change, or their Heikin Ashi variants—allowing experimentation with different market dimensions.
Risk Management: All exits are precisely controlled, either by the next opposing signal, by volatility-adjusted levels, or by fixed risk/reward ratios.
Backtest & Optimization: The strategy is fully backtestable within TradingView’s Strategy Tester, with adjustable parameters for optimization.
Customization & Usage
Indicator Source: Select your preferred data type for EMA calculation, opening the door to creative strategy variations (e.g., volume momentum, pure price trend, rate of change divergence).
Filter Toggles: Enable/disable ADX and volume filters as desired—useful for different market environments.
Exit Mode Selection: Switch between reverse, ATR, or percent-based exits with a single parameter—ideal for adapting to ranging vs. trending markets.
Visual Clarity: The EMA line color reflects its underlying source, and the info panel summarizes all critical values for easy monitoring.
Who Should Use This Strategy?
Trend Followers seeking to ride strong moves with multiple exit options.
Experienced Traders who want to experiment with different data types (volume, momentum, Heikin Ashi) for trend analysis.
Algorithmic Traders looking for a robust, flexible base to build upon with their own ideas.
Getting Started
Apply the script to your chart and review default settings.
Customize parameters—EMA length, ADX threshold, volume settings, exit type—as desired.
Backtest on multiple instruments and timeframes to evaluate performance.
Optimize filters, exit rules, and risk parameters for your preferred trading style.
Monitor with the real-time info panel and trade alerts.
Disclaimer
This script is for educational and entertainment purposes only. It is not financial advice. Past performance is not indicative of future results. Always conduct thorough testing and consider your risk tolerance before trading real capital.
— Happy Trading —
Feel free to adapt, share, and contribute to this open-source strategy!

AI's Opinion Trading System V21. Complete Summary of the Indicator Script
AI’s Opinion Trading System V2 is an advanced, multi-factor trading tool designed for the TradingView platform. It combines several technical indicators (moving averages, RSI, MACD, ADX, ATR, and volume analysis) to generate buy, sell, and hold signals. The script features a customizable AI “consensus” engine that weighs multiple indicator signals, applies user-defined filters, and outputs actionable trade instructions with clear stop loss and take profit levels. The indicator also tracks sentiment, volume delta, and allows for advanced features like pyramiding (adding to positions), custom stop loss/take profit prices, and flexible signal confirmation logic. All key data and signals are displayed in a dynamic, color-coded table on the chart for easy review.
2. Full Explanation of the Table
The table is a real-time dashboard summarizing the indicator’s logic and recommendations for the most recent bars. It is color-coded for clarity and designed to help traders quickly understand market conditions and AI-driven trade signals.
Columns (from left to right):
Column Name What it Shows
Bar The time context: “Now” for the current bar, then “Bar -1”, “Bar -2”, etc. for previous bars.
Raw Consensus The raw AI consensus for each bar: “Buy”, “Sell”, or “-” (neutral).
Up Vol The amount of volume on up (rising) bars.
Down Vol The amount of volume on down (falling) bars.
Delta The difference between up and down volume. Green if positive, red if negative, gray if neutral.
Close The closing price for each bar, color-coded by price change.
Sentiment Diff The difference between the close and average sentiment price (a custom sentiment calculation).
Lookback The number of bars used for sentiment calculation (if enabled).
ADX The ADX value (trend strength).
ATR The ATR value (volatility measure).
Vol>Avg “Yes” (green) if volume is above average, “No” (red) otherwise.
Confirm Whether the AI signal is confirmed over the required bars.
Logic Output The AI’s interpreted signal after applying user-selected logic: “Buy”, “Sell”, or “-”.
Final Action The final signal after all filters: “Buy”, “Sell”, or “-”.
Trade Instruction A plain-English instruction: Buy/Sell/Add/Hold/No Action, with price, stop loss, and take profit.
Color Coding:
Green: Positive/bullish values or signals
Red: Negative/bearish values or signals
Gray: Neutral or inactive
Blue background: For all table cells, for visual clarity
White text: Default, except for color-coded cells
3. Full User Instructions for Every Input/Style Option
Below are plain-language instructions for every user-adjustable option in the indicator’s input and style pages:
Inputs
Table Location
What it does: Sets where the summary table appears on your chart.
How to use: Choose from 9 positions (Top Left, Top Center, Top Right, etc.) to avoid overlapping with other chart elements.
Decimal Places
What it does: Controls how many decimal places prices and values are displayed with.
How to use: Increase for assets with very small prices (e.g., SHIB), decrease for stocks or forex.
Show Sentiment Lookback?
What it does: Shows or hides the “Lookback” column in the table, which displays how many bars are used in the sentiment calculation.
How to use: Turn off if you want a simpler table.
AI View Mode
What it does: Selects the logic for how the AI combines signals from different indicators.
Majority: Follows the most common signal among all indicators.
Weighted: Uses custom weights for each type of signal.
Custom: Lets you define your own logic (see below).
How to use: Pick the logic style that matches your trading philosophy.
AI Consensus Weight / Vol Delta Weight / Sentiment Weight
What they do: When using “Weighted” AI View Mode, these let you set how much influence each factor (indicator consensus, volume delta, sentiment) has on the final signal.
How to use: Increase a weight to make that factor more important in the AI’s decision.
Custom AI View Logic
What it does: Lets advanced users write their own logic for when the AI should signal a trade (e.g., “ai==1 and delta>0 and sentiment>0”).
How to use: Only use if you understand basic boolean logic.
Use Custom Stop Loss/Take Profit Prices?
What it does: If enabled, you can enter your own fixed stop loss and take profit prices for buys and sells.
How to use: Turn on to override the auto-calculated SL/TP and enter your desired prices below.
Custom Buy/Sell Stop Loss/Take Profit Price
What they do: If custom SL/TP is enabled, these fields let you set exact prices for stop loss and take profit on both buy and sell trades.
How to use: Enter your preferred price, or leave at 0 for auto-calculation.
Sentiment Lookback
What it does: Sets how many bars the sentiment calculation should look back.
How to use: Increase to smooth out sentiment, decrease for faster reaction.
Max Pyramid Adds
What it does: Limits how many times you can add to an existing position (pyramiding).
How to use: Set to 1 for no adds, higher for more aggressive scaling in trends.
Signal Preset
What it does: Quick-sets a group of signal parameters (see below) for “Robust”, “Standard”, “Freedom”, or “Custom”.
How to use: Pick a preset, or select “Custom” to adjust everything manually.
Min Bars for Signal Confirmation
What it does: Sets how many bars a signal must persist before it’s considered valid.
How to use: Increase for more robust, less frequent signals; decrease for faster, but possibly less reliable, signals.
ADX Length
What it does: Sets the period for the ADX (trend strength) calculation.
How to use: Longer = smoother, shorter = more sensitive.
ADX Trend Threshold
What it does: Sets the minimum ADX value to consider a trend “strong.”
How to use: Raise for stricter trend confirmation, lower for more trades.
ATR Length
What it does: Sets the period for the ATR (volatility) calculation.
How to use: Longer = smoother volatility, shorter = more reactive.
Volume Confirmation Lookback
What it does: Sets how many bars are used to calculate the average volume.
How to use: Longer = more stable volume baseline, shorter = more sensitive.
Volume Confirmation Multiplier
What it does: Sets how much current volume must exceed average volume to be considered “high.”
How to use: Increase for stricter volume filter.
RSI Flat Min / RSI Flat Max
What they do: Define the RSI range considered “flat” (i.e., not trending).
How to use: Widen to be stricter about requiring a trend, narrow for more trades.
Style Page
Most style settings (such as plot colors, label sizes, and shapes) are preset in the script for visual clarity.
You can adjust plot visibility and colors (for signals, stop loss, take profit) in the TradingView “Style” tab as with any indicator.
Buy Signal: Shows as a green triangle below the bar when a buy is triggered.
Sell Signal: Shows as a red triangle above the bar when a sell is triggered.
Stop Loss/Take Profit Lines: Red and green lines for SL/TP, visible when a trade is active.
SL/TP Labels: Small colored markers at the SL/TP levels for each trade.
How to use:
Toggle visibility or change colors in the Style tab if you wish to match your chart theme or preferences.
In Summary
This indicator is highly customizable—you can tune every aspect of the AI logic, risk management, signal filtering, and table display to suit your trading style.
The table gives you a real-time, comprehensive view of all relevant signals, filters, and trade instructions.
All inputs are designed to be intuitive—hover over them in TradingView for tooltips, or refer to the explanations above for details.

Gorgo's Hybrid Oscillator STrategy**Indicator Name:** Gorgo's Hybrid Oscillator STrategy (G.H.O.S.T.)
**Purpose:**
The Gorgo's Hybrid Oscillator STrategy (G.H.O.S.T.) is a multi-component technical analysis tool designed to identify overbought and oversold market conditions, assess trend strength, and signal potential buy and sell opportunities. By combining elements from RSI, Ultimate Oscillator, Stochastic CCI, and ADX, this custom indicator provides a comprehensive view of momentum, trend intensity, and volume context to enhance decision-making.
---
**Components and Logic:**
1. **RSI (Relative Strength Index):**
* Calculated using a customizable period (default: 14) and based on the hlc3 price source.
* Measures recent price changes to evaluate overbought/oversold conditions.
* Incorporated in the final oscillator average.
2. **Ultimate Oscillator:**
* Combines three timeframes (7, 14, 28 by default) to smooth out price movements.
* Uses true range and buying pressure for multi-frame momentum analysis.
* Averaged together with RSI to create the main oscillator signal.
3. **Stochastic CCI:**
* Applies a stochastic process to the Commodity Channel Index (CCI).
* Smooths the %K and %D lines (default: 3 each) to detect subtle reversals.
* Generates oversold (<35) and overbought (>69) signals, plotted as yellow circles.
4. **ADX + DI (Average Directional Index):**
* Determines trend strength using ADX and directional movement indicators (DI).
* ADX threshold is set at 24 by default to filter weak trends.
* Colored histogram columns:
* Green: Strong bullish trend.
* Red: Strong bearish trend.
* Gray: Weak/no trend.
5. **Volume Analysis:**
* Calculates a 9-period SMA of volume.
* Detects significant volume spikes (2.7× the average by default) to validate breakouts or fakeouts.
6. **Oscillator Output ("osc") and Levels:**
* The main plotted oscillator line is the average of the RSI and Ultimate Oscillator.
* Important horizontal lines:
* Overbought (69.0)
* Oversold (35.0)
* Midline (52.0): Neutral reference point.
* ADX threshold line (24.0)
---
**Signals:**
1. **Buy Signal Conditions:**
* Close is less than or equal to open (candle is red).
* Oscillator is decreasing and below oversold level.
* Stochastic CCI is below midline.
* Volume is above average, or excessive volume with oscillator falling below 40.
* ADX confirms trend presence (either above 15 or meeting threshold).
2. **Sell Signal Conditions:**
* ADX increasing and confirming trend.
* Oscillator is increasing and above overbought level.
* Stochastic CCI is above midline.
* Volume is above average, or very high with oscillator above 60.
3. **Visual Feedback:**
* Yellow dots highlight oversold/overbought Stochastic CCI.
* Oscillator line in cyan.
* Background colors:
* Light red for buy signals.
* White for sell signals.
4. **Alerts:**
* Built-in `alertcondition()` calls allow automated alerts for buy and sell events.
---
**Usage Guide:**
* **Best Use Cases:** Trend-following and reversal strategies on any timeframe.
* **Avoid Using Alone:** Use G.H.O.S.T. in conjunction with price action, support/resistance, and other confluence tools.
* **Customization:** All thresholds, periods, and volumes are user-editable from the settings panel.
---
**Interpretation Summary:**
G.H.O.S.T. excels at filtering out noise by combining different oscillators and volume signals to offer contextually valid entries and exits. A bullish (buy) signal typically suggests a market under pressure but potentially bottoming out, while a bearish (sell) signal highlights likely exhaustion after a strong upward push.
This hybrid approach makes the G.H.O.S.T. a reliable ally in volatile or choppy conditions where single-indicator strategies might fail.

RACZ-SIGNAL-V2.1RACZ-SIGNAL-V2.1 – Reactive Analytical Confluence Zones
Developed by: RACZ Trading
Indicator Type: Multi-Factor Confluence System
Overlay: Off (separate pane)
Purpose: Detect powerful trade opportunities through confluence of technical signals.
⸻
🔍 What is RACZ?
RACZ stands for Reactive Analytical Confluence Zones.
It’s a high-precision trading tool built for traders who rely on multi-signal confirmation, momentum alignment, and market structure awareness.
Rather than relying on a single technical metric, RACZ dynamically combines RSI, VWAP-RSI, Divergence, ADX, and Volume Analytics to produce a composite signal score from 0 to 12 — the higher the score, the stronger the signal.
⸻
🧠 How It Works – Core Components
1. RSI Analysis
• Detects momentum shifts.
• Compares RSI value to overbought (default: 67) and oversold (default: 33) thresholds.
• Adds points to Bullish or Bearish score.
2. VWAP-RSI
• Uses RSI based on VWAP (Volume Weighted Average Price).
• Adds weight to signals influenced by volume-adjusted price movement.
3. Divergence Detection
• Detects potential reversal zones.
• Bullish Divergence: RSI crosses up from low zone.
• Bearish Divergence: RSI crosses down from high zone.
• Strong confluence signal when present.
4. ADX Dynamic Strength Filter
• Custom-calculated ADX (trend strength indicator).
• Uses a dynamic threshold derived from SMA of ADX over a lookback period, scaled by a factor (default 0.9).
• Ensures signals are only validated in strong trend environments.
5. Volume Z-Score
• Detects anomalies in volume behavior.
• Z-score applied to 20-period volume average & deviation.
• Labels spikes, drops, high/low volume conditions.
⸻
📊 Signal Scoring Logic
Each component (RSI, VWAP-RSI, Divergence, ADX) can score up to 3 points each.
• Bullish Score: Total from bullish alignment of each factor.
• Bearish Score: Total from bearish alignment of each factor.
• Signal Power = max(bullish, bearish)
📈 Signal Interpretation
• BUY: Bullish Score > Bearish Score
• SELL: Bearish Score > Bullish Score
• NEUTRAL: Scores are equal
• Signal power is plotted on a 0–12 histogram:
• 0–5 = Weak
• 6–8 = Medium
• 9–12 = Strong (High Confluence Zone)
🖥️ Live Status Panel (Top-Right Corner)
This real-time panel helps you break down the signal:Component
Value Explanation: RSI / VWAP / DIV / ADX
Shows points contributing to signal
SIGNAL: Current market bias (BUY, SELL, NEUTRAL)
VOLUME: Volume classification (Spike, Drop, High, Low, Normal)
Color-coded for quick interpretation.
✅ How to Use
1. Look at Histogram: Bars ≥6 suggest valid setups, especially ≥9.
2. Confirm Panel Agreement: Check which components are supporting the signal.
3. Validate Volume: Unusual spikes/drops often precede strong moves.
4. Follow Direction: Use BUY/SELL signals aligned with signal power and trend.
⸻
⚙️ Customizable Inputs
• RSI period, overbought/oversold levels
• VWAP-RSI period
• ADX period and dynamic threshold settings
• Fully adjustable to fit any trading style
⸻
🚀 Why Choose RACZ?
• Clarity: Scores & signals derived from multiple tools, not just one.
• Confluence Logic: Designed for traders who look for confirmation across indicators.
• Speed: Real-time responsiveness to changing market dynamics.
• Volume Awareness: Integrated volume intelligence gives a deeper edge.
⸻
⚠️ Disclaimer
This indicator is intended strictly for educational and informational purposes only. It is not financial advice and should not be used to make actual investment decisions. Always conduct your own research or consult with a licensed financial advisor before trading or investing. Use of this script is at your own risk.

Combined EMA Technical AnalysisThis script is written in Pine Script (version 5) for TradingView and creates a comprehensive technical analysis indicator called "Combined EMA Technical Analysis." It overlays multiple technical indicators on a price chart, including Exponential Moving Averages (EMAs), VWAP, MACD, PSAR, RSI, Bollinger Bands, ADX, and external data from the S&P 500 (SPX) and VIX indices. The script also provides visual cues through colors, shapes, and a customizable table to help traders interpret market conditions.
Here’s a breakdown of the script:
---
### **1. Purpose**
- The script combines several popular technical indicators to analyze price trends, momentum, volatility, and market sentiment.
- It uses color coding (green for bullish, red for bearish, gray/white for neutral) and a table to display key information.
---
### **2. Custom Colors**
- Defines custom RGB colors for bullish (`customGreen`), bearish (`customRed`), and neutral (`neutralGray`) signals to enhance visual clarity.
---
### **3. User Inputs**
- **EMA Colors**: Users can customize the colors of five EMAs (8, 20, 9, 21, 50 periods).
- **MACD Settings**: Adjustable short length (12), long length (26), and signal length (9).
- **RSI Settings**: Adjustable length (14).
- **Bollinger Bands Settings**: Length (20), multiplier (2), and proximity threshold (0.1% of band width).
- **ADX Settings**: Adjustable length (14).
- **Table Settings**: Position (e.g., "Bottom Right") and text size (e.g., "Small").
---
### **4. Indicator Calculations**
#### **Exponential Moving Averages (EMAs)**
- Calculates five EMAs: 8, 20, 9, 21, and 50 periods based on the closing price.
- Used to identify short-term and long-term trends.
#### **Volume Weighted Average Price (VWAP)**
- Resets daily and calculates the average price weighted by volume.
- Color-coded: green if price > VWAP (bullish), red if price < VWAP (bearish), white if neutral.
#### **MACD (Moving Average Convergence Divergence)**
- Uses short (12) and long (26) EMAs to compute the MACD line, with a 9-period signal line.
- Displays "Bullish" (green) if MACD > signal, "Bearish" (red) if MACD < signal.
#### **Parabolic SAR (PSAR)**
- Calculated with acceleration factors (start: 0.02, increment: 0.02, max: 0.2).
- Indicates trend direction: green if price > PSAR (bullish), red if price < PSAR (bearish).
#### **Relative Strength Index (RSI)**
- Measures momentum over 14 periods.
- Highlighted in green if > 70 (overbought), red if < 30 (oversold), white otherwise.
#### **Bollinger Bands (BB)**
- Uses a 20-period SMA with a 2-standard-deviation multiplier.
- Color-coded based on price position:
- Green: Above upper band or close to it.
- Red: Below lower band or close to it.
- Gray: Neutral (within bands).
#### **Average Directional Index (ADX)**
- Manually calculates ADX to measure trend strength:
- Strong trend: ADX > 25.
- Very strong trend: ADX > 50.
- Direction: Bullish if +DI > -DI, bearish if -DI > +DI.
#### **EMA Crosses**
- Detects bullish (crossover) and bearish (crossunder) events for:
- EMA 9 vs. EMA 21.
- EMA 8 vs. EMA 20.
- Visualized with green (bullish) or red (bearish) circles.
#### **SPX and VIX Data**
- Fetches daily closing prices for the S&P 500 (SPX) and VIX (volatility index).
- SPX trend: Bullish if EMA 9 > EMA 21, bearish if EMA 9 < EMA 21.
- VIX levels: High (> 25, fear), Low (< 15, stability).
- VIX color: Green if SPX bullish and VIX low, red if SPX bearish and VIX high, white otherwise.
---
### **5. Visual Outputs**
#### **Plots**
- EMAs, VWAP, and PSAR are plotted on the chart with their respective colors.
- EMA crosses are marked with circles (green for bullish, red for bearish).
#### **Table**
- Displays a summary of indicators in a customizable position and size.
- Indicators shown (if enabled):
- EMA 8/20, 9/21, 50: Green dot if bullish, red if bearish.
- VWAP: Green if price > VWAP, red if price < VWAP.
- MACD: Green if bullish, red if bearish.
- MACD Zero: Green if MACD > 0, red if MACD < 0.
- PSAR: Green if price > PSAR, red if price < PSAR.
- ADX: Arrows for very strong trends (↑/↓), dots for weaker trends, colored by direction.
- Bollinger Bands: Arrows (↑/↓) or dots based on price position.
- RSI: Numeric value, colored by overbought/oversold levels.
- VIX: Numeric value, colored based on SPX trend and VIX level.
---
### **6. Alerts**
- Triggers alerts for EMA 8/20 crosses:
- Bullish: "EMA 8/20 Bullish Cross on Candle Close!"
- Bearish: "EMA 8/20 Bearish Cross on Candle Close!"
---
### **7. Key Features**
- **Flexibility**: Users can toggle indicators on/off in the table and adjust parameters.
- **Visual Clarity**: Consistent use of green (bullish), red (bearish), and neutral colors.
- **Comprehensive**: Combines trend, momentum, volatility, and market sentiment indicators.
---
### **How to Use**
1. Add the script to TradingView.
2. Customize inputs (colors, lengths, table position) as needed.
3. Interpret the chart and table:
- Green signals suggest bullish conditions.
- Red signals suggest bearish conditions.
- Neutral signals indicate indecision or consolidation.
4. Set up alerts for EMA crosses to catch trend changes.
This script is ideal for traders who want a multi-indicator dashboard to monitor price action and market conditions efficiently.

Supertrend + MACD with Advanced FiltersDetailed Guide
1. Indicator Overview
Purpose:
This enhanced indicator combines Supertrend and MACD to signal potential trend changes. In addition, it now includes several extra filters for more reliable signals:
Multi-Timeframe (MTF) Confirmation: Checks a higher timeframe’s trend.
ADX (Momentum) Filter: Ensures the market is trending strongly.
Dynamic Factor Adjustment: Adapts the Supertrend sensitivity to current volatility.
Volume Filter: Verifies that current volume is above average.
Each filter can be enabled or disabled according to your preference.
How It Works:
The Supertrend calculates dynamic support/resistance levels based on ATR and an adjustable factor, while MACD identifies momentum shifts via its crossovers. The additional filters then confirm whether the conditions meet your criteria for a trend change. If all enabled filters align, the indicator plots a shape and triggers an alert.
2. Supertrend Component with Dynamic Factor
Base Factor & ATR Period:
The Supertrend uses these inputs to compute its dynamic bands.
Dynamic Factor Toggle:
When enabled, the factor is adjusted by comparing the current ATR to its simple moving average. This makes the indicator adapt to higher or lower volatility conditions, helping to reduce false signals.
3. MACD Component
Parameters:
Standard MACD settings (Fast MA, Slow MA, Signal Smoothing) determine the responsiveness of the MACD line. Crossovers between the MACD line and its signal line indicate potential trend reversals.
4. Multi-Timeframe (MTF) Filter
Function:
If enabled, the indicator uses a higher timeframe’s simple moving average (SMA) to confirm the prevailing trend.
Bullish Confirmation: The current close is above the higher timeframe SMA.
Bearish Confirmation: The current close is below the higher timeframe SMA.
5. ADX Filter (Momentum)
Custom Calculation:
Since the built-in ta.adx function may not be available, a custom ADX is calculated. This involves:
Determining positive and negative directional movements (DMs).
Smoothing these values to obtain +DI and -DI.
Calculating the DX and then smoothing it to yield the ADX.
Threshold:
Only signals where the ADX exceeds the set threshold (default 20) are considered valid, ensuring that the market is trending strongly enough.
6. Volume Filter
Function:
Checks if the current volume exceeds the average volume (SMA) multiplied by a specified factor. This helps confirm that a price move is supported by sufficient trading activity.
7. Combined Signal Logic & Alerts
Final Signal:
A bullish signal is generated when:
MACD shows a bullish crossover,
Supertrend indicates an uptrend,
And all enabled filters (MTF, ADX, volume) confirm the signal.
The bearish signal is generated similarly in the opposite direction.
Alerts:
Alert conditions are set so that TradingView can notify you via pop-up, email, or SMS when these combined conditions are met.
8. User Adjustments
Toggle Filters:
Use the on/off switches for MTF, ADX, and Volume filters as needed.
Parameter Tuning:
Adjust the ATR period, base factor, higher timeframe settings, ADX period/threshold, and volume multiplier to match your trading style and market conditions.
Backtesting:
Always backtest your settings to ensure that they perform well with your strategy.
Fortuna Trend Predictor**Fortuna Trend Predictor**
### Overview
**Fortuna Trend Predictor** is a powerful trend analysis tool that combines multiple technical indicators to estimate trend strength, volatility, and probability of price movement direction. This indicator is designed to help traders identify potential trend shifts and confirm trade setups with improved accuracy.
### Key Features
- **Trend Strength Analysis**: Uses the difference between short-term and long-term Exponential Moving Averages (EMA) normalized by the Average True Range (ATR) to determine trend strength.
- **Directional Strength via ADX**: Calculates the Average Directional Index (ADX) manually to measure the strength of the trend, regardless of its direction.
- **Probability Estimation**: Provides a probabilistic assessment of price movement direction based on trend strength.
- **Volume Confirmation**: Incorporates a volume filter that validates signals when the trading volume is above its moving average.
- **Volatility Filter**: Uses ATR to identify high-volatility conditions, helping traders avoid false signals during low-volatility periods.
- **Overbought & Oversold Levels**: Includes RSI-based horizontal reference lines to highlight potential reversal zones.
### Indicator Components
1. **ATR (Average True Range)**: Measures market volatility and serves as a denominator to normalize EMA differences.
2. **EMA (Exponential Moving Averages)**:
- **Short EMA (20-period)** - Captures short-term price movements.
- **Long EMA (50-period)** - Identifies the overall trend.
3. **Trend Strength Calculation**:
- Formula: `(Short EMA - Long EMA) / ATR`
- The higher the value, the stronger the trend.
4. **ADX Calculation**:
- Computes +DI and -DI manually to generate ADX values.
- Higher ADX indicates a stronger trend.
5. **Volume Filter**:
- Compares current volume to a 20-period moving average.
- Signals are more reliable when volume exceeds its average.
6. **Volatility Filter**:
- Detects whether ATR is above its own moving average, multiplied by a user-defined threshold.
7. **Probability Plot**:
- Formula: `50 + 50 * (Trend Strength / (1 + abs(Trend Strength)))`
- Values range from 0 to 100, indicating potential movement direction.
### How to Use
- When **Probability Line is above 70**, the trend is strong and likely to continue.
- When **Probability Line is below 30**, the trend is weak or possibly reversing.
- A rising **ADX** confirms strong trends, while a falling ADX suggests consolidation.
- Combine with price action and other confirmation tools for best results.
### Notes
- This indicator does not generate buy/sell signals but serves as a decision-support tool.
- Works best on higher timeframes (H1 and above) to filter out noise.
---
### Example Chart
*The chart below demonstrates how Fortuna Trend Predictor can help identify strong trends and avoid false breakouts by confirming signals with volume and volatility filters.*

Profit Hunter @DaviddTechProfit Hunter @DaviddTech is an advanced multi-strategy indicator designed to give traders a significant edge in identifying high-probability trading opportunities across all market conditions. By combining the power of T3 adaptive moving averages, ADX-based trend strength analysis, SuperTrend trailing stops, and dynamic support/resistance detection, this indicator delivers a complete trading system in one powerful package.
## 📊 Recommended Usage
Timeframes: Most effective on 1H, 4H, and Daily charts for swing trading; 5M and 15M for day trading
Markets: Works across all markets including Forex, Crypto, Indices, and Stocks
Setup Guidelines: Look for T3 crossovers with strong ADX readings (>25) coinciding with breakout signals (yellow dots/red crosses) near key support/resistance levels for highest probability entries
## 🔥 Key Features:
### T3 Adaptive Trend Detection:
Utilizes premium T3 adaptive indicators instead of standard EMAs for superior smoothing and accuracy
Dynamic color-shifting cloud formation between fast and slow T3 lines reveals immediate trend direction
Proprietary transparency algorithm intensifies cloud colors during strong trends based on real-time ADX readings
### Advanced Support & Resistance Mapping:
Automatically identifies and marks key market structure levels during T3 crossovers
Dynamic horizontal level plotting with optional extension for monitoring future price interactions
Intelligent level validation - converts to dotted lines when price breaks through, maintaining visual clarity
### SuperTrend Trailing Stoploss System:
Professional-grade white trailing stop indicator adapts to market volatility using ATR calculations
Generates precise entry and exit signals with optional buy/sell labels at critical reversal points
Visual trend state highlighting for immediate assessment of current market position
### Breakout Detection & Confirmation:
Sophisticated dual-algorithm breakout system combining Bollinger Bands and Keltner Channels
Visual breakout alerts with yellow dots (bullish) and red crosses (bearish) for instant pattern recognition
Validates breakouts against T3 trend direction to minimize false signals
### Alpha Edge Color System:
Utilizes DaviddTech's signature color scheme with bullish green and bearish pink
Revolutionary transparency algorithm translates ADX readings into precise visual intensity
Higher ADX values produce more vivid colors, instantly communicating trend strength without additional indicators
## 💰 Trading Applications:
Alpha Discovery: Identify emerging trends before the majority of market participants
Precision Entry/Exit: Use SuperTrend signals combined with support/resistance levels for optimal trade execution
Risk Management: Set stops based on the white trailing stoploss line for mathematically-optimized protection
Trend Confirmation: Validate setups using the T3 cloud direction and ADX-based intensity
Breakout Trading: Capture explosive moves with confirmed Bollinger/Keltner breakout signals
Swing Position Management: Monitor extended support/resistance levels for multi-day positioning
## ✨ Strategy Example
As shown in the chart image, ideal entries occur when:
The T3 cloud turns bullish (green) or bearish (pink) with strong color intensity
A yellow dot (bullish) or red cross (bearish) breakout signal appears
Price respects the white SuperTrend line as support/resistance
The trade aligns with key horizontal support/resistance levels identified by the indicator
## 📝 Attribution
This indicator builds upon and enhances concepts from:
Market Trend Levels Detector by BigBeluga (support/resistance detection framework)
T3 indicator implementation by DaviddTech (adaptive moving average system)
Average Directional Index (ADX) methodology for trend strength measurement
Profit Hunter @DaviddTech represents the culmination of advanced technical analysis methodologies in one seamless system.

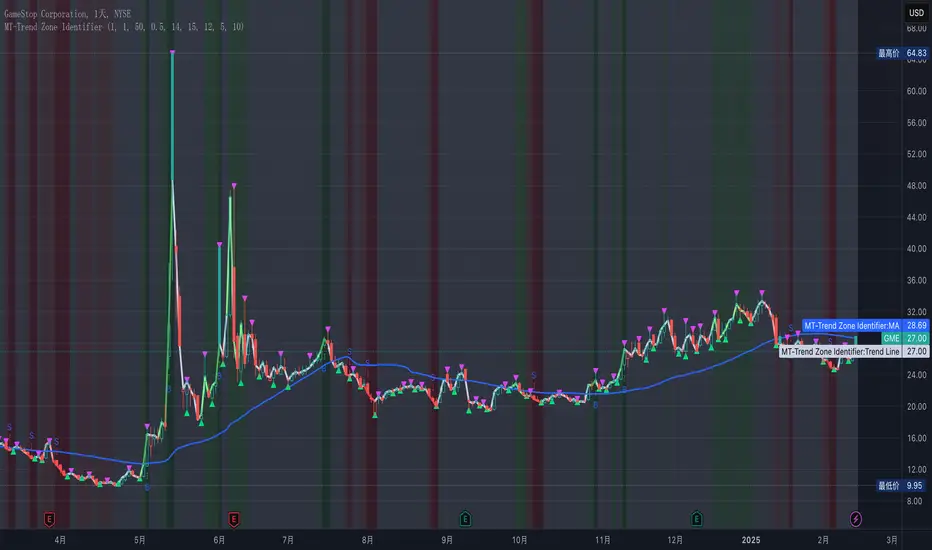
MT-Trend Zone IdentifierTrend Zone Identifier – A Dynamic Market Trend Mapping Tool
Overview
The Trend Zone Identifier is an advanced TradingView indicator that helps traders visualize different market trend phases. By leveraging Pivot Points, Moving Averages (MA), ADX (Average Directional Index), and Retest Confirmation, this tool identifies uptrend, downtrend, and ranging (sideways) conditions dynamically.
This indicator is designed to segment the market into clear trend zones, allowing traders to distinguish between confirmed trends, trend transitions (pending zones), and ranging markets. It provides an intuitive visual overlay to enhance market structure analysis and assist in decision-making.
Key Features
✔ Trend Zone Identification – Classifies price action into Uptrend (Green), Downtrend (Red), Pending Confirmation (Light Colors), and Sideways Market (Gray/Neutral)
✔ Pivot-Based Breakout & Breakdown Detection – Uses pivot highs/lows to determine trend shifts
✔ Moving Average & ADX Validation – Ensures the trend is backed by MA structure and ADX trend strength
✔ Pullback Confirmation – Allows trend confirmation based on price retesting key levels
✔ Extreme Volatility & Gaps Filtering – Optional ATR-based extreme movement filtering to avoid false signals
✔ Multi-Timeframe Support – Option to integrate higher timeframe trend validation
✔ Customizable Sensitivity – Fine-tune MA smoothing, ADX thresholds, pivot detection, and pullback range
How It Works
1. Trend Classification
• Uptrend (Green): Price is above a key MA, ADX confirms strength, and a pivot breakout occurs
• Downtrend (Red): Price is below a key MA, ADX confirms strength, and a pivot breakdown occurs
• Pending Trend (Light Colors): Initial trend breakout or breakdown is detected but requires further confirmation
• Sideways/Ranging (Gray): ADX signals a weak trend, and price remains within a neutral zone
2. Retest & Confirmation Logic
• A trend is only confirmed after a breakout or breakdown followed by a successful retest
• If the market fails the retest, the indicator resets to a neutral state
3. Custom Filters for Optimization
• Enable or disable volume filtering for confirmation
• Adjust pivot sensitivity to detect major or minor swing points
• Choose to require consecutive bars confirming the breakout/breakdown
Ideal Use Cases
🔹 Swing traders who want to capture trend transitions early
🔹 Trend-following traders who rely on confirmed market cycles
🔹 Range traders looking to identify sideways market zones
🔹 Algorithmic traders who need clean trend segmentation for automated strategies
Final Thoughts
The Trend Zone Identifier is a versatile market structure indicator that helps traders define trend cycles visually and avoid trading against weak trends. By providing clear breakout, breakdown, and retest conditions, it enhances market clarity and reduces decision-making errors.
➡ Add this to your TradingView workspace and start analyzing market trends like a pro! 🚀
MTF Signal XpertMTF Signal Xpert – Detailed Description
Overview:
MTF Signal Xpert is a proprietary, open‑source trading signal indicator that fuses multiple technical analysis methods into one cohesive strategy. Developed after rigorous backtesting and extensive research, this advanced tool is designed to deliver clear BUY and SELL signals by analyzing trend, momentum, and volatility across various timeframes. Its integrated approach not only enhances signal reliability but also incorporates dynamic risk management, helping traders protect their capital while navigating complex market conditions.
Detailed Explanation of How It Works:
Trend Detection via Moving Averages
Dual Moving Averages:
MTF Signal Xpert computes two moving averages—a fast MA and a slow MA—with the flexibility to choose from Simple (SMA), Exponential (EMA), or Hull (HMA) methods. This dual-MA system helps identify the prevailing market trend by contrasting short-term momentum with longer-term trends.
Crossover Logic:
A BUY signal is initiated when the fast MA crosses above the slow MA, coupled with the condition that the current price is above the lower Bollinger Band. This suggests that the market may be emerging from a lower price region. Conversely, a SELL signal is generated when the fast MA crosses below the slow MA and the price is below the upper Bollinger Band, indicating potential bearish pressure.
Recent Crossover Confirmation:
To ensure that signals reflect current market dynamics, the script tracks the number of bars since the moving average crossover event. Only crossovers that occur within a user-defined “candle confirmation” period are considered, which helps filter out outdated signals and improves overall signal accuracy.
Volatility and Price Extremes with Bollinger Bands
Calculation of Bands:
Bollinger Bands are calculated using a 20‑period simple moving average as the central basis, with the upper and lower bands derived from a standard deviation multiplier. This creates dynamic boundaries that adjust according to recent market volatility.
Signal Reinforcement:
For BUY signals, the condition that the price is above the lower Bollinger Band suggests an undervalued market condition, while for SELL signals, the price falling below the upper Bollinger Band reinforces the bearish bias. This volatility context adds depth to the moving average crossover signals.
Momentum Confirmation Using Multiple Oscillators
RSI (Relative Strength Index):
The RSI is computed over 14 periods to determine if the market is in an overbought or oversold state. Only readings within an optimal range (defined by user inputs) validate the signal, ensuring that entries are made during balanced conditions.
MACD (Moving Average Convergence Divergence):
The MACD line is compared with its signal line to assess momentum. A bullish scenario is confirmed when the MACD line is above the signal line, while a bearish scenario is indicated when it is below, thus adding another layer of confirmation.
Awesome Oscillator (AO):
The AO measures the difference between short-term and long-term simple moving averages of the median price. Positive AO values support BUY signals, while negative values back SELL signals, offering additional momentum insight.
ADX (Average Directional Index):
The ADX quantifies trend strength. MTF Signal Xpert only considers signals when the ADX value exceeds a specified threshold, ensuring that trades are taken in strongly trending markets.
Optional Stochastic Oscillator:
An optional stochastic oscillator filter can be enabled to further refine signals. It checks for overbought conditions (supporting SELL signals) or oversold conditions (supporting BUY signals), thus reducing ambiguity.
Multi-Timeframe Verification
Higher Timeframe Filter:
To align short-term signals with broader market trends, the script calculates an EMA on a higher timeframe as specified by the user. This multi-timeframe approach helps ensure that signals on the primary chart are consistent with the overall trend, thereby reducing false signals.
Dynamic Risk Management with ATR
ATR-Based Calculations:
The Average True Range (ATR) is used to measure current market volatility. This value is multiplied by a user-defined factor to dynamically determine stop loss (SL) and take profit (TP) levels, adapting to changing market conditions.
Visual SL/TP Markers:
The calculated SL and TP levels are plotted on the chart as distinct colored dots, enabling traders to quickly identify recommended exit points.
Optional Trailing Stop:
An optional trailing stop feature is available, which adjusts the stop loss as the trade moves favorably, helping to lock in profits while protecting against sudden reversals.
Risk/Reward Ratio Calculation:
MTF Signal Xpert computes a risk/reward ratio based on the dynamic SL and TP levels. This quantitative measure allows traders to assess whether the potential reward justifies the risk associated with a trade.
Condition Weighting and Signal Scoring
Binary Condition Checks:
Each technical condition—ranging from moving average crossovers, Bollinger Band positioning, and RSI range to MACD, AO, ADX, and volume filters—is assigned a binary score (1 if met, 0 if not).
Cumulative Scoring:
These individual scores are summed to generate cumulative bullish and bearish scores, quantifying the overall strength of the signal and providing traders with an objective measure of its viability.
Detailed Signal Explanation:
A comprehensive explanation string is generated, outlining which conditions contributed to the current BUY or SELL signal. This explanation is displayed on an on‑chart dashboard, offering transparency and clarity into the signal generation process.
On-Chart Visualizations and Debug Information
Chart Elements:
The indicator plots all key components—moving averages, Bollinger Bands, SL and TP markers—directly on the chart, providing a clear visual framework for understanding market conditions.
Combined Dashboard:
A dedicated dashboard displays key metrics such as RSI, ADX, and the bullish/bearish scores, alongside a detailed explanation of the current signal. This consolidated view allows traders to quickly grasp the underlying logic.
Debug Table (Optional):
For advanced users, an optional debug table is available. This table breaks down each individual condition, indicating which criteria were met or not met, thus aiding in further analysis and strategy refinement.
Mashup Justification and Originality
MTF Signal Xpert is more than just an aggregation of existing indicators—it is an original synthesis designed to address real-world trading complexities. Here’s how its components work together:
Integrated Trend, Volatility, and Momentum Analysis:
By combining moving averages, Bollinger Bands, and multiple oscillators (RSI, MACD, AO, ADX, and an optional stochastic), the indicator captures diverse market dynamics. Each component reinforces the others, reducing noise and filtering out false signals.
Multi-Timeframe Analysis:
The inclusion of a higher timeframe filter aligns short-term signals with longer-term trends, enhancing overall reliability and reducing the potential for contradictory signals.
Adaptive Risk Management:
Dynamic stop loss and take profit levels, determined using ATR, ensure that the risk management strategy adapts to current market conditions. The optional trailing stop further refines this approach, protecting profits as the market evolves.
Quantitative Signal Scoring:
The condition weighting system provides an objective measure of signal strength, giving traders clear insight into how each technical component contributes to the final decision.
How to Use MTF Signal Xpert:
Input Customization:
Adjust the moving average type and period settings, ATR multipliers, and oscillator thresholds to align with your trading style and the specific market conditions.
Enable or disable the optional stochastic oscillator and trailing stop based on your preference.
Interpreting the Signals:
When a BUY or SELL signal appears, refer to the on‑chart dashboard, which displays key metrics (e.g., RSI, ADX, bullish/bearish scores) along with a detailed breakdown of the conditions that triggered the signal.
Review the SL and TP markers on the chart to understand the associated risk/reward setup.
Risk Management:
Use the dynamically calculated stop loss and take profit levels as guidelines for setting your exit points.
Evaluate the provided risk/reward ratio to ensure that the potential reward justifies the risk before entering a trade.
Debugging and Verification:
Advanced users can enable the debug table to see a condition-by-condition breakdown of the signal generation process, helping refine the strategy and deepen understanding of market dynamics.
Disclaimer:
MTF Signal Xpert is intended for educational and analytical purposes only. Although it is based on robust technical analysis methods and has undergone extensive backtesting, past performance is not indicative of future results. Traders should employ proper risk management and adjust the settings to suit their financial circumstances and risk tolerance.
MTF Signal Xpert represents a comprehensive, original approach to trading signal generation. By blending trend detection, volatility assessment, momentum analysis, multi-timeframe alignment, and adaptive risk management into one integrated system, it provides traders with actionable signals and the transparency needed to understand the logic behind them.

Eze Profit Range Detection FilterThe Range Detection Filter is a technical analysis tool designed to help traders identify range-bound market conditions and focus on breakout opportunities. It combines the ATR (Average True Range) for volatility analysis and the ADX (Average Directional Index) for trend strength evaluation to highlight consolidation phases and alert traders when the market is ready to break out.
This indicator provides visual cues and customizable alerts, making it suitable for traders looking to avoid false signals during choppy markets and capitalize on trending moves following a breakout.
What Makes It Unique?
ATR for Volatility:
Measures market volatility by comparing ATR with its moving average.
Consolidation phases are flagged when ATR remains below its moving average for a sustained period.
ADX for Trend Strength:
Monitors trend strength, confirming range-bound conditions when ADX falls below a user-defined threshold (default: 20).
Combines with ATR to ensure accurate detection of trendless periods.
Breakout Alerts:
Notifies traders of breakout opportunities when the price moves outside the highest high or lowest low of the range.
How It Works:
Range Detection:
The market is considered "in range" when:
ATR is below its moving average, indicating low volatility.
ADX is below the threshold, confirming a lack of trend strength.
Visual Indication:
A yellow background highlights range-bound conditions, allowing traders to avoid low-probability trades.
Breakout Detection:
Alerts are triggered for breakouts above or below the range to help traders identify potential opportunities.
Features:
Range Highlighting:
Automatically detects and highlights range-bound markets using a yellow background.
Breakout Alerts:
Sends alerts for breakouts above or below the range once the market exits consolidation.
Customizable Inputs:
ATR length, moving average length, and ADX parameters are fully adjustable to adapt to various trading styles and asset classes.
Multi-Timeframe Compatibility:
Suitable for all markets and timeframes, including stocks, forex, and cryptocurrencies.
How to Use:
Identify Ranges:
Avoid trading when the yellow background appears, signaling a range-bound market.
Focus on Breakouts:
Look for alerts indicating breakouts above or below the range for potential trending opportunities.
Combine with Other Indicators:
Use volume analysis, momentum oscillators, or candlestick patterns to confirm breakout signals.
Credits:
This script utilizes widely accepted methodologies for ATR and ADX calculations. ADX is calculated manually using directional movement (+DI and -DI) for precise trend detection. The concept has been adapted and enhanced to create this comprehensive range-detection tool.
Notes:
This indicator is intended for educational purposes and should not be used as standalone financial advice.
Always incorporate this tool into a broader trading strategy for optimal results.

Post-Open Long Strategy with ATR-based Stop Loss and Take ProfitThe "Post-Open Long Strategy with ATR-Based Stop Loss and Take Profit" is designed to identify buying opportunities after the German and US markets open. It combines various technical indicators to filter entry signals, focusing on breakout moments following price lateralization periods.
Key Components and Their Interaction:
Bollinger Bands (BB):
Description: Uses BB with a 14-period length and standard deviation multiplier of 1.5, creating narrower bands for lower timeframes.
Role in the Strategy: Identifies low volatility phases (lateralization). The lateralization condition is met when the price is near the simple moving average of the BB, suggesting an imminent increase in volatility.
Exponential Moving Averages (EMA):
10-period EMA: Quickly detects short-term trend direction.
200-period EMA: Filters long-term trends, ensuring entries occur in a bullish market.
Interaction: Positions are entered only if the price is above both EMAs, indicating a consolidated positive trend.
Relative Strength Index (RSI):
Description: 7-period RSI with a threshold above 30.
Role in the Strategy: Confirms the market is not oversold, supporting the validity of the buy signal.
Average Directional Index (ADX):
Description: 7-period ADX with 7-period smoothing and a threshold above 10.
Role in the Strategy: Assesses trend strength. An ADX above 10 indicates sufficient momentum to justify entry.
Average True Range (ATR) for Dynamic Stop Loss and Take Profit:
Description: 14-period ATR with multipliers of 2.0 for Stop Loss and 4.0 for Take Profit.
Role in the Strategy: Adjusts exit levels based on current volatility, enhancing risk management.
Resistance Identification and Breakout:
Description: Analyzes the highs of the last 20 candles to identify resistance levels with at least two touches.
Role in the Strategy: A breakout above this level signals a potential continuation of the bullish trend.
Time Filters and Market Conditions:
Trading Hours: Operates only during the opening of the German market (8:00 - 12:00) and US market (15:30 - 19:00).
Panic Candle: The current candle must close negative, leveraging potential emotional reactions in the market.
Avoiding Entry During Pullbacks:
Description: Checks that the two previous candles are not both bearish.
Role in the Strategy: Avoids entering during a potential pullback, improving trade success probability.
Post-Open Long Strategy with ATR-Based Stop Loss and Take Profit
The "Post-Open Long Strategy with ATR-Based Stop Loss and Take Profit" is designed to identify buying opportunities after the German and US markets open. It combines various technical indicators to filter entry signals, focusing on breakout moments following price lateralization periods.
Key Components and Their Interaction:
Bollinger Bands (BB):
Description: Uses BB with a 14-period length and standard deviation multiplier of 1.5, creating narrower bands for lower timeframes.
Role in the Strategy: Identifies low volatility phases (lateralization). The lateralization condition is met when the price is near the simple moving average of the BB, suggesting an imminent increase in volatility.
Exponential Moving Averages (EMA):
10-period EMA: Quickly detects short-term trend direction.
200-period EMA: Filters long-term trends, ensuring entries occur in a bullish market.
Interaction: Positions are entered only if the price is above both EMAs, indicating a consolidated positive trend.
Relative Strength Index (RSI):
Description: 7-period RSI with a threshold above 30.
Role in the Strategy: Confirms the market is not oversold, supporting the validity of the buy signal.
Average Directional Index (ADX):
Description: 7-period ADX with 7-period smoothing and a threshold above 10.
Role in the Strategy: Assesses trend strength. An ADX above 10 indicates sufficient momentum to justify entry.
Average True Range (ATR) for Dynamic Stop Loss and Take Profit:
Description: 14-period ATR with multipliers of 2.0 for Stop Loss and 4.0 for Take Profit.
Role in the Strategy: Adjusts exit levels based on current volatility, enhancing risk management.
Resistance Identification and Breakout:
Description: Analyzes the highs of the last 20 candles to identify resistance levels with at least two touches.
Role in the Strategy: A breakout above this level signals a potential continuation of the bullish trend.
Time Filters and Market Conditions:
Trading Hours: Operates only during the opening of the German market (8:00 - 12:00) and US market (15:30 - 19:00).
Panic Candle: The current candle must close negative, leveraging potential emotional reactions in the market.
Avoiding Entry During Pullbacks:
Description: Checks that the two previous candles are not both bearish.
Role in the Strategy: Avoids entering during a potential pullback, improving trade success probability.
Entry and Exit Conditions:
Long Entry:
The price breaks above the identified resistance.
The market is in a lateralization phase with low volatility.
The price is above the 10 and 200-period EMAs.
RSI is above 30, and ADX is above 10.
No short-term downtrend is detected.
The last two candles are not both bearish.
The current candle is a "panic candle" (negative close).
Order Execution: The order is executed at the close of the candle that meets all conditions.
Exit from Position:
Dynamic Stop Loss: Set at 2 times the ATR below the entry price.
Dynamic Take Profit: Set at 4 times the ATR above the entry price.
The position is automatically closed upon reaching the Stop Loss or Take Profit.
How to Use the Strategy:
Application on Volatile Instruments:
Ideal for financial instruments that show significant volatility during the target market opening hours, such as indices or major forex pairs.
Recommended Timeframes:
Intraday timeframes, such as 5 or 15 minutes, to capture significant post-open moves.
Parameter Customization:
The default parameters are optimized but can be adjusted based on individual preferences and the instrument analyzed.
Backtesting and Optimization:
Backtesting is recommended to evaluate performance and make adjustments if necessary.
Risk Management:
Ensure position sizing respects risk management rules, avoiding risking more than 1-2% of capital per trade.
Originality and Benefits of the Strategy:
Unique Combination of Indicators: Integrates various technical metrics to filter signals, reducing false positives.
Volatility Adaptability: The use of ATR for Stop Loss and Take Profit allows the strategy to adapt to real-time market conditions.
Focus on Post-Lateralization Breakout: Aims to capitalize on significant moves following consolidation periods, often associated with strong directional trends.
Important Notes:
Commissions and Slippage: Include commissions and slippage in settings for more realistic simulations.
Capital Size: Use a realistic trading capital for the average user.
Number of Trades: Ensure backtesting covers a sufficient number of trades to validate the strategy (ideally more than 100 trades).
Warning: Past results do not guarantee future performance. The strategy should be used as part of a comprehensive trading approach.
With this strategy, traders can identify and exploit specific market opportunities supported by a robust set of technical indicators and filters, potentially enhancing their trading decisions during key times of the day.

TASC 2024.08 Volume Confirmation For A Trend System█ OVERVIEW
This script demonstrates the use of volume data to validate price movements based on the techniques Buff Pelz Dormeier discusses in his "Volume Confirmation For A Trend System" article from the August 2024 edition of TASC's Traders' Tips . It presents a trend-following system implementation that utilizes a combination of three indicators: the Average Directional Index (ADX), the Trend Thrust Indicator (TTI), and the Volume Price Confirmation Indicator (VPCI).
█ CONCEPTS
In his article, Buff Pelz Dormeier recounts his search for an optimal trend-following strategy enhanced with volume data, starting with a simple system combining the ADX , MACD , and OBV indicators. Even in these early tests, the author observed that the volume confirmation from OBV notably improved trading performance. Subsequently, the author replaced OBV with his VPCI, which considers the proportional weights of volume and price, to enhance the validation of trend momentum. Lastly, the author explored the inclusion of his TTI, a modified MACD that features volume-based enhancements, as a strategy component for improved trend-following performance.
According to the author's research, the ADX+TTI+VPCI system outperformed similar strategies he tested in the article, yielding significantly higher returns and enhanced perceived reliability. Because the system's design revolves around catching pronounced trends, it performs best with a portfolio of individual stocks. The author applies the system in the article by allocating 5% of the equity to long positions in S&P 500 components that meet the ADX+TTI+VPCI entry criteria (see the Calculations section below for details). He uses the proceeds from closing positions to enter new positions in other stocks meeting the screening criteria, holding any excess proceeds in cash.
█ CALCULATIONS
The TTI is similar to the MACD. Its calculation entails the following steps:
Calculate fast (short-term) and slow (long-term) volume-weighted moving averages (VWMAs).
Compute the volume multiple (VM) as the square of the ratio of the fast VWMA to the slow VWMA.
Adjust these averages by multiplying the fast VWMA by the VM and dividing the slow VWMA by the VM.
Calculate the difference between the adjusted VWMAs to determine the TTI value, and take the average of that series to determine the signal line value.
The VPCI utilizes differences and ratios between VWMAs and corresponding simple moving averages (SMAs) to provide an alternative volume-price confirmation tool. Its calculation is as follows:
Subtract the slow SMA from the VWMA of the same length to calculate the volume-price confirmation/contradiction (VPC) value.
Divide the fast VWMA by the corresponding fast SMA to determine the volume-price ratio (VPR).
Divide the short-term VWMA by the long-term VWMA to calculate the VM.
Compute the VPCI as the product of the VPC, VPR, and VM values.
The long entry criteria of the ADX+TTI+VPCI system are as follows:
The ADX is above 30.
The TTI crosses above its signal line.
The VPCI is above 0, confirming the trend.
Signals to close positions occur when the VPCI is below 0, indicating a contradiction .
NOTE: Unlike in the article, this script applies the ADX+TTI+VPCI system to one stock at a time , not a portfolio of S&P 500 constituents.
█ DISCLAIMER
This strategy script educates users on the trading system outlined by the TASC article. By default, it uses 10% of equity as the order size and a slippage amount of 5 ticks. Traders should adjust these settings and the commission amount when using this script.

StableF-MainIt is combination of Built in Super trend and Adx with take profit
uptrend is considered when +dmi is above -dmi and +dmi is above 25 and adx is above 25 and supertrend gives Buy
downtrend is considered when -dmi is above +dmi and -dmi is above 25 and adx is above 25 and supertrend give sell
use fibo for target by taking as previous swing high and swing low
-supertrend crossover is referred as buy plotshape
-supertrend cross under is referred as Sell plotshape
-keep stoploss at dot line of supertrend
-adx-dmi crossover (+dmi crossed above -dmi) is shown by Triangle Up symbol
-adx-dmi crossunder( -dmi crosses below +dmi) is shown by Triangle down symbol
--Cross symbol with blue line with linewidth 2 is referred as Take profit
--combine this with adx -dmi setting with 7 and 14
----disclaimer-----
used free built in supertrend and adx so u can use same setting in other broker or in trading view
not responsible for any loss or gain
-only for educational purpose
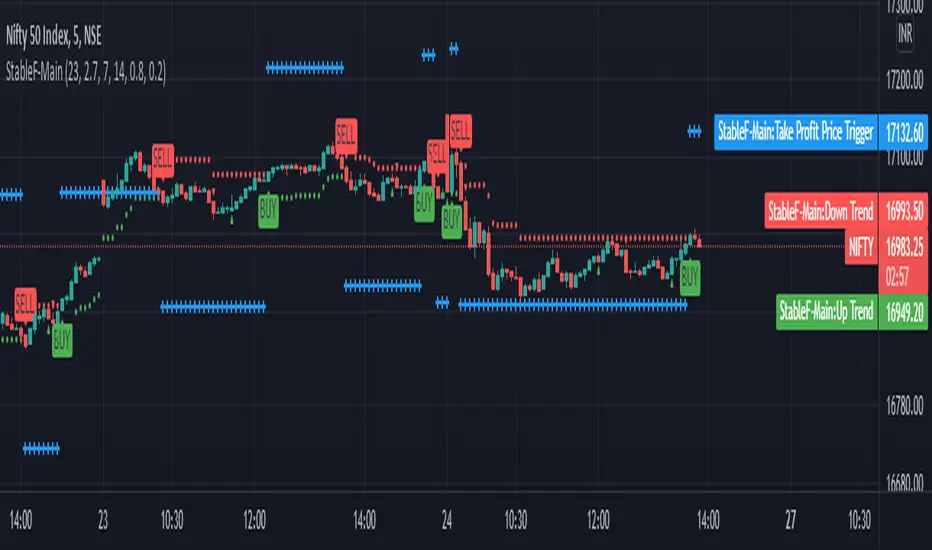
Strength Momentum IndicatorThis indicator is a fork of . It takes it a step further by including RSI and ADX information, which are represented in this indicator as follows:
MOM: The histogram itself is a linear regression curve, by default for the study period the Fibonacci series and exponential moving average were used. You can adjust the settings to your liking.
RSI: Whenever the RSI is outside the normal ranges (which you can adjust in the settings), the bar in the histogram will turn amber to warn you.
ADX: Crosses are drawn along the 0 line to indicate the ADX . Blue means that the ADX is below the trend level (adjustable in the settings), and orange means that it is above that level. Darker colors indicate that the ADX has risen from the previous bar, while lighter colors indicate that it has fallen.
Almost all of the normally adjustable values can be adjusted in the settings for each of the base indicators. Also adjustable:
The RSI alert levels (30 and 70 by default).
The ADX crossover, i.e. the point at which the ADX value is considered to indicate a strong trend (25 by default).
All colors, naturally.
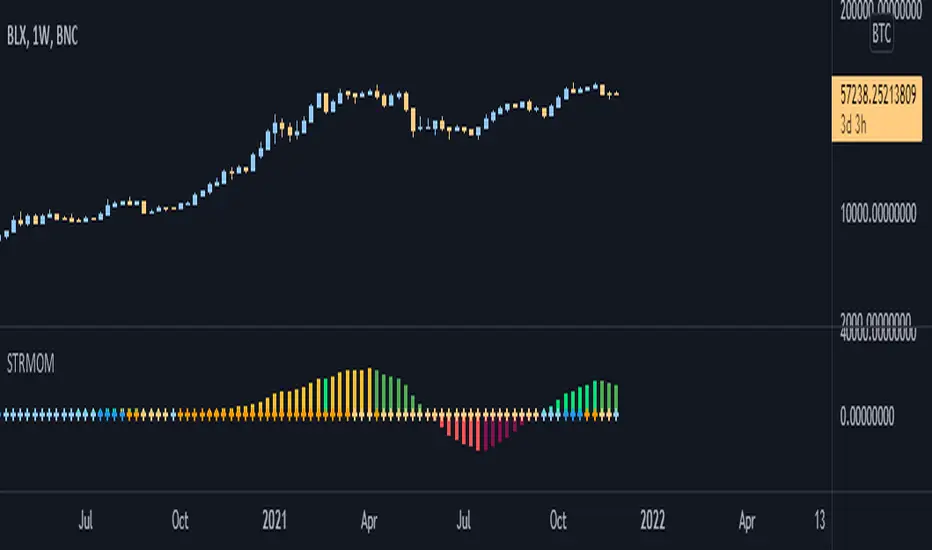
DMI Swings (by Coinrule)The Directional Movement Index is a handy indicator that helps catch the direction in which the price of an asset is moving. It compares the prior highs and lows to draw three lines:
Positive directional line (+DI)
Negative directional line (-DI)
Average direction index (ADX)
DMI is simple to interpret. When +DI > - DI, it means the price is trending up. On the other hand, when -DI > +DI, the trend is weak or moving on the downside.
The ADX does not give an indication about the direction but about the strength of the trend.
Typically values of ADX above 25 mean that the trend is steeply moving up or down, based on the -DI and +D positioning. This script aims to capture swings in the DMI, and thus, in the trend of the asset, using a contrarian approach.
ENTRY
-DI is greater than +DI
ADX is greater than 45
EXIT
+DI is greater than -DI
ADX is greater than 45
Trading on high values of ADX, the strategy tries to spot extremely oversold and overbought conditions. Values of ADX above 45 may suggest that the trend has overextended and is may be about to reverse.
Our backtests suggest that this script performs well for very short-term scalping strategies on low time frames, such as the 1-minute.
The script considers a 0.1% trading fee to make results more realistic to those you can expect from live market conditions. So realistically, live results should be similar to backtested results.
You can plug this script directly into your crypto exchange using TradingView Signals on Coinrule.
Trade Safely!

LB Squeeze Momentum DivergencesThis study tries to highlight LazyBear Squeeze Momentum divergences
as they are defined by
TradingLatino TradingView user
Squeeze momentum green peaks are connected by a line
Associated prices to these green peaks are also connected
If both lines have a different slope orientation
then there is a divergence.
It only shows two last divergence lines and angles.
The original chart screenshot shows some divergence lines
on the top or main chart
these were drawn manually
because you cannot write to two different charts
from the same pine script study (Well, not in August 2020 anyways)
It's aimed at BTCUSDT pair and 4h timeframe.
HOW IT WORKS
Simple geometric mathematics are used
to calculate the two lines degrees
Then both degrees are compared
to show if both lines agree ( // or \\ )
or if they disagree ( /\ or \/ )
SETTINGS
(SQZDiver) Show degrees : Show degrees of each Squeeze Momentum Divergence
lines to the x-axis.
(SQZDiver) Show desviation labels : Whether to show
or not desviation labels for the Squeeze Momentum Divergences.
(SQZDiver) Show desviation lines : Whether to show
or not desviation lines for the Squeeze Momentum Divergences.
(ADX) Smoothing
(ADX) DI Length
(ADX) key level
(ADX) Print : Whether to show
or not scaled ADX line
(SQZMOM) BB Length
(SQZMOM) BB MultFactor
(SQZMOM) KC Length
(SQZMOM) KC MultFactor
(SQZMOM) Use TrueRange (KC)
(SQZMOM) Print : Whether to show
or not Squeeze Momentum indicator.
WARNING
Some securities and timeframes might output degrees
too next to zero.
The code might need to be tweaked to meet your needs.
USAGE
One strategy is to sell when you are in a long entry
when you find out that the price slope is upwards ( / )
while the lb smilb slope is downwards: ( \ )
E.g. You will see:
/
\
on the indicator.
Why?
Because it might signal you that the price is
going to correct downwards soon.
FEEDBACK 1
Please let me know if there is any
other strategy based on the red side of
LB Squeeze Momentum
so that I might add support for it in the future.
FEEDBACK 2
Calculating degrees in a chart
with a different x-axis scale
is a nightmare
that's why I did not a range settings
so that values next to zero are
converted into zero
and thus showing an horizontal line.
Feedback is welcome on this matter.
EXTRA 1
If you turn off showing the divergence lines
and if you turn off showing the divergence labels
you almost get what TradingLatino user uses
as its default momentum indicator.
EXTRA 2
Optionally this indicator can show you
a rescaled ADX (it only works properly on 2020 Bitcoin charts)
ABOUT COLOURS
TradingLatino user has both dark green and light green
inverted compared to this LB SQZMOM chart.
CREDITS
I have reused and adapted some code from
'Squeeze Momentum Indicator' study
which it's from TradingView LazyBear user.
I have reused and adapted some code from
'Directional Movement Index + ADX & Keylevel Support' study
which it's from TradingView console user.

Price Action Trading System v0.3 by JustUncleL with modifcationsThe base of this script is the Price Action Trading System from JustUncle .
I have first combined it with script ADX and DI by BeikabuOyaji to indicate when the +DI is above the -DI and the ADX is above 20. This is represented by crosses at the top of the page: green indicating that the +DI is above the -DI and ADX above 20, and red if -DI is above the +DI and ADX above 20. If the ADX is increasing in slope while the +DI is above the -DI, an up green arrow is shown at the bottom of the page, indicating an increase in this trend, and the slope of the ADX is increasing and the -DI is above the +DI, a down arrow is shown at the bottom. One could think to a green cross with a green up arrow as a potential buy opportunity, and a red cross with a red down arrow as a potential sell opportunity.
Next, I have combined this script with the Indicator: WaveTrend Oscillator from Lazybear . If the oscillator has readings below -45 and the slope of the line is increasing, a green diamond appears above the chart. This indicates a potential buy opportunity. If the oscillator has readings above 50 and the slope of the line is decreasing, a red diamond appears above the chart. This indicates a potential sell opportunity. Now if the slope of the oscillator is rising significantly but does not hit the -45 threshold to start its increase, but is negative in value, a green flag appears at the top of the page. This represents a potential buy opportunity. If the slope of the oscillator is significantly decreasing and is positive in value, a red flag appears at the bottom of the page. This represents a potential sell opportunity.
The base of this script, the Price Action Trading System v0.3 by JustUncle , has many of its own features that I have kept. If the MACD is positive, the background colour is green. If it is negative, the colour is red. If the CCI and RSI indicate an oversold opportunity and the MACD is positive, you get an up olive arrow below the chart. If they indicate an overbought opportunity and the MACD is negative, you get a red down arrow above the chart. If the CCI value stays oversold after a green arrow, the candle chart turns turquoise, and if overbought, turns black after a red arrow.
You can use these indicators in combination to help you with your trading strategy.

N Option Selling 1
**NIFTY Weekly Option Seller – Regime & Risk Framework (HTF + RSI)**
This indicator is a **decision-support tool for NIFTY option sellers**, designed to identify whether current market conditions favor:
* **Iron Condor (IC)** – range / mean-reversion
* **Put Credit Spread (PCS)** – bullish bias
* **Call Credit Spread (CCS)** – bearish bias
The script focuses on **structure selection and risk management**, not trade execution.
---
## Core logic
### 1) Multi-timeframe context
* Signals are calculated on the **active chart timeframe** (commonly 4H).
* **Daily (HTF) EMA trend and Daily ADX** are used as **gating conditions**, ensuring strong directional scores are not allowed against the higher-timeframe context.
This prevents aggressive trend selling when the daily structure does not support it.
---
### 2) Three independent regime scores (0–5)
The script computes three capped and smoothed scores:
* **IC score (Range quality)**
Based on low ADX, price inside CPR, proximity to VWAP, Camarilla H3–L3, daily range confirmation, and mid-band RSI.
* **PCS score (Bullish structure)**
Based on EMA up-stack, trend strength (ADX), price relative to CPR/VWAP, with RSI and Daily trend acting as **brakes**, not entry signals.
* **CCS score (Bearish structure)**
Based on EMA down-stack, trend strength (ADX), price relative to CPR/VWAP, with RSI and Daily trend acting as **brakes**, not entry signals.
RSI is used only to **cap aggressiveness at extremes**, not to predict reversals.
---
### 3) Cross-penalty & smoothing
* When multiple regimes score high simultaneously, **cross-penalties reduce conflicting scores** so only one regime dominates.
* Final scores are **smoothed across bars** to avoid frequent regime flips and unstable sizing decisions.
---
### 4) Regime selection
The script selects **one primary regime** (IC / PCS / CCS) based on the highest adjusted score, with tie-break logic that prefers trend regimes only when ADX confirms strength; otherwise it defaults to IC.
---
### 5) Non-repainting reference levels
The indicator plots key **previous-day, non-repainting levels**:
* CPR (Low / High with Narrow–Wide classification)
* Camarilla H3, L3, H4, L4
* VWAP
These are contextual reference levels for structure and risk placement.
---
### 6) DEFEND / HARVEST prompts
Using ATR-based proximity logic, the script provides:
* **DEFEND** alerts when price approaches modeled risk zones
* **HARVEST** alerts when sufficient cushion exists
* **REGIME** alerts on confirmed regime changes
These are **risk-management prompts**, not buy/sell signals.
---
### 7) Visual dashboard
A compact panel displays:
* Active regime and score
* ADX / RSI
* CPR width classification
* EMA structure and tightness
* VWAP proximity
* IC / PCS / CCS scores
* Key level snapshot
---
## Intended use
* Designed for **weekly option selling**
* Best used on **4H charts with Daily context**
* Suitable for traders who manage positions **once per day**
* Encourages **structure-first thinking** (IC base with controlled directional bias)
---
## Disclaimer
This indicator does **not place trades** and does not calculate position size or P&L.
It is a **market regime and risk-awareness tool** and must be used with proper capital management and execution discipline.

Next Candle PredictorAdvanced TradingView Indicator for Precise Buy and Sell Signals
Overview:
The Predicta Futures - Next Candle Predictor is a cutting-edge TradingView indicator designed to forecast the next candle's direction in futures and cryptocurrency markets. Leveraging a multi-indicator confluence strategy, this tool provides traders with actionable long and short prediction percentages, enhanced by dynamic ADX-based thresholds and visual projection candles. Ideal for scalping, day trading, or swing trading on platforms like MEXC or Binance futures, it combines Supertrend, MACD, RSI, Stochastic, ADX, and volume analysis to deliver high-probability buy and sell signals while minimizing false positives.
Key Features:
• Multi-Indicator Confluence Scoring:
Integrates Supertrend for trend direction, EMAs (8, 21, 50) for alignment, MACD for momentum crossovers, RSI for overbought/oversold conditions, Stochastic for divergence detection, ADX for trend strength, and volume ratios for confirmation. A customizable confluence score (0-6) ensures signals meet user-defined criteria, reducing whipsaws in volatile markets.
• Dynamic Prediction Thresholds:
ADX-driven adjustments lower the required prediction percentage (e.g., 60% in strong trends) for "PERFECT TIME" entries, adapting to market conditions like ranging or trending phases.
• Visual Analysis Table:
A sleek, color-coded dashboard displays progress bars for each indicator, prediction percentages, and status (e.g., "PERFECT TIME" or "WAIT"). Supports long and short analyses with intuitive ASCII bars for quick scans.
• Projection Candles:
Simulates potential next-candle outcomes with volatility-scaled (via Bollinger Bands width) green long and red short candles, aiding in visualizing price targets.
• Buy/Sell Signals and Alerts:
Generates labeled "BUY" and "SELL" arrows on EMA crossovers within confirmed trends, with separate alerts for basic signals and high-confluence "PERFECT TIME" opportunities.
• Customizable Inputs:
Adjust ATR periods, Supertrend factors, minimum confluence scores, and volume ratios to tailor the indicator for stocks, forex, or crypto perpetual futures.
How It Works:
This TradingView script calculates long and short scores using weighted contributions from key indicators, normalizing them into prediction percentages. A confluence check—factoring trend, EMA alignment, MACD, Stochastic, volume, and ADX—triggers "PERFECT TIME" only when conditions align robustly. For example:
• In a downtrend (Supertrend red), with bearish MACD and Stochastic, and sufficient volume, the indicator highlights short opportunities.
• Dynamic thresholds ensure aggressive entries in strong trends (ADX >25) and conservative ones in weak trends.
• Backtested for reliability, it excels in identifying reversals and continuations, making it a must-have for traders seeking an edge in futures trading strategies.
Usage Instructions:
1. Add the indicator to your TradingView chart. (Search: Next Candle Predictor)
2. Customize settings via the inputs panel (e.g., set minConfluence to 5 for stricter signals).
3. Monitor the analysis table for predictions and confluence scores.
4. Act on "BUY/SELL" labels or "PERFECT TIME" alerts, combining with your risk management.
5. Enable projection candles for visual forecasting of the next bar.
Compatible with all timeframes, from 1-minute scalping to daily swings. Note: This is not financial advice; always verify signals with additional analysis.
Join thousands of traders enhancing their strategies—add it to your charts today and elevate your trading performance!
Please rate and review if it boosts your trades!
Thank you!

Flow Control Oscillator (FCO)Flow Control Oscillator (FCO)
The Flow Control Oscillator (FCO) is a momentum-based indicator that combines volume analysis and money flow to determine who is in control of the market—buyers or sellers—and how strong that control is. Unlike pure price-based oscillators, FCO integrates both price action and volume distribution to provide a more complete picture of market dynamics.
How It Works
Core Components:
Money Flow Index (MFI) -
Scaled to -1 to +1 range
Measures the flow of money into and out of an asset
Identifies buying and selling pressure based on price and volume
Chaikin Money Flow (CMF) -
Already in -1 to +1 range
Measures the accumulation/distribution of volume
Shows whether volume is accumulating (buying) or distributing (selling)
Combined Flow Control Line (FCO Line) -
Equal-weighted composite of MFI and CMF
Smoothed with SMA (default: 3 periods)
Values above 0 = Buyers in control
Values below 0 = Sellers in control
Signal Line -
WMA of the FCO line (default: 6 periods)
Used for timing entries and confirming momentum shifts
Momentum Histogram-
Shows the rate of change in buyer/seller control
Weighted by ADX (Average Directional Index) when enabled
Larger bars = stronger momentum
ADX weighting filters out choppy, unreliable signals
Key Zones
Neutral Zone (-0.3 to +0.3): Balanced market, low conviction
Healthy Trend Zone (±0.3 to ±0.7): Clear control without exhaustion
Warning Zone (±0.7 to ±1.0): Extended, approaching exhaustion
Extreme Zone (beyond ±1.0): Overbought/oversold, reversal likely
What To Look For
Reversal Setups:
FCO in extreme zone (beyond ±1.0)
FCO crosses Signal line in opposite direction
Momentum histogram shrinking (weakening pressure)
Interpretation: Buyers or sellers are exhausted and losing control
Trend Strength Setups:
FCO crosses zero line (control shift)
Momentum histogram growing in the same direction
ADX confirms strong trend (no orange background)
Signal line moving in same direction as FCO
Interpretation: New control being established with building momentum
Divergences:
Price makes new high/low but FCO doesn't confirm
Indicates weakening momentum despite price movement
Early warning of potential reversal
Choppy Market Warning:
Orange background (ADX < 20)
Small momentum bars regardless of FCO position
Interpretation: Weak trend, avoid trading or use tight stops
Best Practices:
Use with context: Combine with support/resistance levels (like VWAP) for confluence
Multi-timeframe confirmation: Check higher timeframe FCO for overall bias
Wait for confirmation: Let signals develop rather than predicting turns
Respect extreme zones: Best reversal opportunities occur when FCO is beyond ±1.0
Filter with ADX: Pay attention to background coloring—avoid choppy conditions
The indicator includes comprehensive alert conditions for:
Reversal setups (extreme + cross + weakening momentum)
Trend strength signals (zero cross + growing momentum + strong ADX)
FCO/Signal crossovers
Extreme overbought/oversold conditions
Control shifts (buyers/sellers taking control)

TwinPulse Q Lead SPY x QQQ Intermarket Pulse 1HTwinPulse Q Lead is a concise one hour indicator for SPY and QQQ that converts three sources of market information into a single pulse line, a mode readout with BUY SELL WAIT, and compact alerts. It blends intermarket leadership between QQQ and SPY, intraday flow from the slope of session VWAP, and where the current price sits inside the regular trading hours range. The three components are normalized, fused, compressed to a stable range, and smoothed for clear thresholds. The aim is a readable intraday regime signal that helps you decide when to participate and when to stand aside.
The script is built with Pine v6, uses request security with lookahead off, and does not repaint. It is an indicator, not a strategy. It does not contain any solicitation, links, or outside references. The description is self contained and explains both logic and use so that any trader can understand the design without reading code.
What makes this original and useful
Intermarket leadership is measured directly from QQQ and SPY on your working timeframe using a Z score of the return spread. When growth is leading value heavy large caps, leadership turns positive. When it lags, leadership turns negative. This gives a real time read of the Nasdaq versus S and P tug of war that most day traders watch informally.
Intraday flow is taken from the slope of the session VWAP. A linear regression of VWAP over a short window captures whether value is rising or falling inside the day. Dividing by ATR normalizes slope by typical movement so that the signal is comparable across weeks.
Session position places price inside the current regular hours high to low. It answers whether the day is trading in the top half, the bottom half, or the middle. This is a simple but powerful context filter for breakouts and fades.
The three components are fused into one pulse, compressed with either hyperbolic tangent or softsign to keep values bounded, and then smoothed by a short EMA. This yields a stable range with a zero line so the eye can read shifts quickly.
The panel shows a human readable mode with reasons and a strength score. Traders who do not want to read lines can rely on a simple state and a compact justification that explains why the state is set.
This is not a mashup that simply overlays unrelated indicators. Each component was chosen to answer a distinct question that is common to SPY and QQQ intraday decision making. Leadership answers who is in charge, flow answers whether value inside the session is building or leaking, and position answers if price is pressing the extremes or circling the middle. The pulse ties the three together and prevents any single component from dominating.
How the calculations work
Leadership. Compute a short rate of change for SPY and QQQ. Subtract SPY from QQQ to get spread returns, then compute a rolling Z score over a longer window. Positive values mean QQQ is leading. Negative values mean SPY is leading.
Flow. Compute session VWAP on the active symbol. Regress VWAP over a short window to obtain a slope estimate. Divide by ATR to scale slope by current volatility so that a small rise on a quiet day is not treated the same as a small rise on a wild day.
Position. Track the highest high and lowest low since the start of regular hours. Place the current close inside that range on a zero to one scale, then recenter to a minus one to plus one scale. Positive means the top half of the day, negative means the bottom half.
Fusion. Multiply each component by a weight so users can emphasize or de emphasize leadership, flow, or position. Sum to a raw pulse.
Compression. Pass the raw pulse through a bounded function. Hyperbolic tangent is smooth and has natural saturation near the extremes. Softsign is faster and behaves like a smoother version of sign near zero. Compression avoids unbounded excursions and makes thresholds meaningful across days.
Smoothing. Apply a short EMA to the compressed pulse to reduce noise. This creates the main line called TwinPulse in the plot.
Thresholds. You can use static symmetric levels or adaptive levels. The adaptive option computes a mean and a standard deviation of the smoothed pulse over a user window, then sets upper and lower thresholds as mean plus or minus sigma times standard deviation. This allows thresholds to adjust across regimes. Static levels are still available for traders who want repeatable levels.
Events and mode. A long event fires when the smoothed pulse crosses the upper threshold with positive flow and any optional filters agree. A short event fires on the symmetric condition. The mode reads the current state rather than fire and forget. It returns BUY when the smoothed pulse is above the upper threshold with positive flow, SELL when the smoothed pulse is below the lower threshold with negative flow, otherwise WAIT. A cooldown controls how often events can fire so alerts do not spam during choppy periods.
Inputs and default values
The script ships with defaults chosen for SPY and QQQ on one hour charts.
Symbols. SPY and QQQ by default. You can switch to any pair. Many users may test IWM versus SPY for small cap reads.
Regular hours selector. On by default. This restricts the position factor to New York regular hours. Turn it off if you prefer full session behavior.
ROC length is three bars. Z score length is fifty bars. VWAP slope window is ten bars. ATR length is fourteen bars. Pulse smoothing length is three bars.
Compression mode. Choose hyperbolic tangent or softsign. Hyperbolic tangent is default.
Weights. Leadership and flow are one by default. Position is set to zero point seven to give a modest influence to where price sits inside the day.
Thresholds. Adaptive thresholds are on by default with a lookback of one hundred bars and a sigma width of zero point eight. Static levels at plus or minus zero point six are ready if you disable adaptive mode.
Filters. ADX filter is off by default. If you enable it, the script requires ADX above a user minimum before it will signal. Higher time frame confirmation is off by default. When enabled it compares the smoothed pulse on the confirm timeframe to zero and requires alignment for longs or shorts.
Cooldown. Three bars by default so that alerts do not trigger too frequently.
UI. Bar coloring is on by default. The panel is on by default and sits at the top right.
All request security calls use lookahead off and will not request future data. All persistent state variables are assigned in a way that prevents repainting. The indicator does not use non standard chart types in its logic.
How to use the indicator
Load a one hour chart of SPY or QQQ. Keep a clean chart so that the script output is easy to read.
Turn on regular hours if you want the session position to reflect the cash session. This is recommended for SPY and QQQ.
Watch the panel. Mode reads BUY or SELL or WAIT. The strength value is a simple vote based score that ranges from zero to one hundred. It counts leadership, flow, ADX if enabled, and higher time frame confirmation if enabled. You can use strength to filter weak states.
Consider action only when mode is BUY or SELL and the signal has not just fired on the last bar. The triangles mark where an event fired. Alerts use the same logic as the events. WAIT means stand aside.
To slow the system, enable ADX and set a higher minimum or enable higher time frame confirmation. To speed it up, disable the filters, disable adaptive thresholds, or tighten the sigma width.
When publishing, use a clean chart with only this indicator. Show the symbol and timeframe clearly and make sure the plot legend is visible. If you add drawings on the chart, only include ones that help readers understand the output.
Publication notes and compliance
This description is written in English. The title uses ASCII and only uses capital letters for common abbreviations. The script is original and explains how and why the components work together. There are no links or promotional material. The script does not claim performance. It does not use lookahead. The panel and alerts exist to help a human read and act with discipline. The indicator can be published as open source or as protected. If you choose protected, the description still allows readers to understand how the logic works without access to the code.
If you later convert the logic into a strategy for publication, use realistic commission and slippage, risk no more than a small share of equity per trade, and choose a dataset that yields a large enough sample. Explain any deviations from these default recommendations in your strategy description. Do not publish results from non standard chart types since they can mislead readers on signal timing.
Limitations and risks
Intermarket leadership is a relative measure. There are hours when both SPY and QQQ fall while leadership remains positive. Treat leadership as a context, not a stand alone trigger.
VWAP slope is a path measure inside the session. It can flip several times on a choppy day. That is why the script uses a short smoothing and an optional cooldown. Use ADX or higher time frame confirmation to avoid the worst chop.
Session position assumes a meaningful regular hours range. On half days or around openings with gaps the position factor can be less informative. If this bothers you, reduce the weight of position or turn it off.
Compression and smoothing introduce lag by design. The goal is stability and clarity. If you want earlier but noisier signals, reduce smoothing and weights, and use static thresholds.
No indicator guarantees future results. TwinPulse Q Lead is a decision aid. It should be combined with your risk rules, position size policy, and a clear exit plan. Past behavior is not a promise for the future.
Frequently asked questions
What symbols are supported. Any symbol can be used as the chart symbol. Leadership uses the two user symbols which default to SPY and QQQ. Many traders may try IWM versus SPY or DIA versus SPY.
Can I change the timeframe. Yes, but the design target is one hour. On very short timeframes the VWAP slope becomes very sensitive and you should consider stronger filters.
Does the script repaint. No. It uses request security with lookahead off and the panel updates on the last bar only. Events are based on bar close conditions unless you attach alerts on any alert function call which will still respect the logic without looking into the future.
How are the strength numbers built. The strength score is the share of aligned votes across leadership, flow, ADX if enabled, and higher time frame confirmation if enabled. A value near one hundred means many filters agree. A value near fifty means partial alignment. It is not a probability or an accuracy number.
Can I use non standard chart types. You can view the indicator on them but do not publish signals from non standard chart types because that can mislead readers about timing. Use classic candles or bars when you publish and when you test.
Why do I sometimes see BUY but the price is not moving. A BUY mode requires pulse above the upper threshold and positive flow. It does not require higher highs immediately. Treat BUY as a permission to look for entries using your own execution rules.
