🔵 Introduction "Zigzag" is an indicator that forms based on price changes. Essentially, the function of this indicator is to connect consecutive and alternating High and Low pivots. This pattern assists in analyzing price changes and can also be used to identify classic patterns. "Zigzag" is an analytical tool that, by filtering partial price movements based on...
The indicator includes an Awesome Oscillator with 2 vertical lines at a distance of 100 and 140 bars from the last bar to determine the third Elliott wave by the maximum peak of AO in the interval from 100 to 140 bars according to Bill Williams' Profitunity strategy. Additionally, a faster EMA line is displayed that calculates the difference between 5 Period and...
The indicator displays the number of visible bars on the screen (in the upper right corner), including the prices of the highest and lowest bars, the maximum or minimum value of the Awesome Oscillator (similar to MACD 5-34-5) for identify the 3-wave Elliott peak in the interval of 100 to 140 bars according to the Profitunity strategy of Bill Williams. The values...
█ OVERVIEW This indicator displays zigzag based on high and low using latest pine script version 5 , chart.point which using time, index and price as parameters. Pretty much a strip down using latest pine script function, without any use of library . This allow pine script user to have an idea of simplified and cleaner code for zigzag. █ CREDITS ...
The Relative Strength Index Wave Indicator was created by Constance Brown (Technical Analysis for the Trading Professional), and this is a unique indicator that uses the weighted close formula, but instead of using the typical price values, it uses the RSI calculated from the various prices. It then creates a rainbow by smoothing the weighted RSI with four...
The Elliott Wave indicator allows users to detect Elliott Wave (EW) impulses as well as corrective segments automatically on the chart. These are detected and displayed serially, allowing users to keep track of the evolution of an impulse or corrective wave. Fibonacci retracements constructed from detected impulse waves are also included. This script...
Sinusoidal High Pass Filter This script implements a sinusoidal high pass filter, which is a type of digital filter that is used to remove low frequency components from a signal. The filter is defined by a series of weights that are applied to the input data, with the weights being determined by a sinusoidal function. The resulting filtered signal is then plotted...
Quick Description: Smoothed RSI with optimized trailing moving average. Look for cross above or cross under signals for buy and sell orders respectively. VIDYA moving average of RSI incorporated with "optimized trend tracker" system. Thanks to kivancozbilgic and anilozeksi for implementing this great idea on Tradingview. The indicator adds "1,000" to the RSI MA...
##Wave Chart v1## For analyzing Neo-wave theory Plot the market's highs and lows in real-time order. Then connect the highs and lows with a diagonal line. Next, the last plot of one day (or bar) is connected with a straight line to the first plot of the next day (or bar). ##How To Use## if you want a weekly chart you drop the time frame to the daily...
This is a very standard version of the Wave Trend Oscillator. The Channel and Average values are displayed as lines, most people display them as areas. The Channel and Average difference is displayed as a histogram, most people display it as a tiny noisy area. I was unable to find a standard version of the Wave Trend Oscillator. The colorful hyped up versions of...
experimental: translates a gaussian wave to collapse from high/low peaks, slice of a pun intended to the cat in the box :)
This indicator displays volume as a pump wave. Can be useful for chart analysis and easy detection of anomalies/trends.
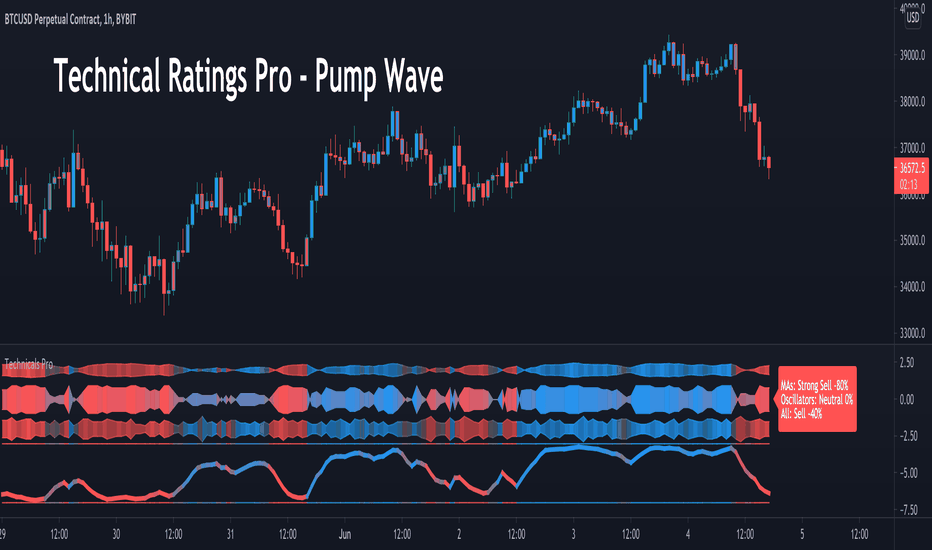
This script uses the built in Technical Ratings indicator but interprets the data visually. It plots the results for "total", "MA" and "other" as pump waves. It uses MA to plot a trend line (can be turned off in settings) . Candles are colored to the rating strength and a percentage number was added to the results. For more informations on the Technical Ratings...
Price curves consist of much noise and little signal. For separating the latter from the former, John Ehlers proposed in the Stocks&Commodities May 2021 issue an unusual approach: Treat the price curve like a radio wave. Apply AM and FM demodulating technology for separating trade signals from the underlying noise. reference: financial-hacker.com
With Special Thanks to Everyone who has gone before me, and who have both allowed me given me permission to bring my version of Market Cipher to the World Especially LazyBear for his amazing Wave Trend Oscillator and for Aevir, falconCoin, vumanchu, Crypto_Spike and others who have freely brought MarketCipher to the Tradingview Community Also special mention to...
Using RSI and 4 exponential moving averages, I created this indicator so that you can spot inconsistencies between price action and RSI. There's a lot of misunderstanding surrounding RSI, most people think if something's 'oversold' buying is a guarantee win. This definitely isn't the case as there's many more variable to consider. In addition, with this indicator,...
DGT interpreted version of LazyBear's WaveTrend, visualizing on Price Chart Original Author : LazyBear Crosses above or below threshold are emphasized with bigger labels - crosses above threshold : probable short indications with a bigger label and relativly small label for probable long indications - crosses below threshold : probable long indications with a...
![ZigZag Multi [TradingFinder] Trend & Wave Lines - Structures XAUUSD: ZigZag Multi [TradingFinder] Trend & Wave Lines - Structures](https://s3.tradingview.com/t/tMhLigMe_mid.png)


![Relative Strength Index Wave Indicator [CC] AAPL: Relative Strength Index Wave Indicator [CC]](https://s3.tradingview.com/w/W9uJOvkF_mid.png)

![Elliott Wave [LuxAlgo] BTCUSD: Elliott Wave [LuxAlgo]](https://s3.tradingview.com/k/KvrhsPTp_mid.png)


![WaveTrend [LazyBear] vX by DGT EOSUSDT: WaveTrend [LazyBear] vX by DGT](https://s3.tradingview.com/c/cYG1lqRI_mid.png)
