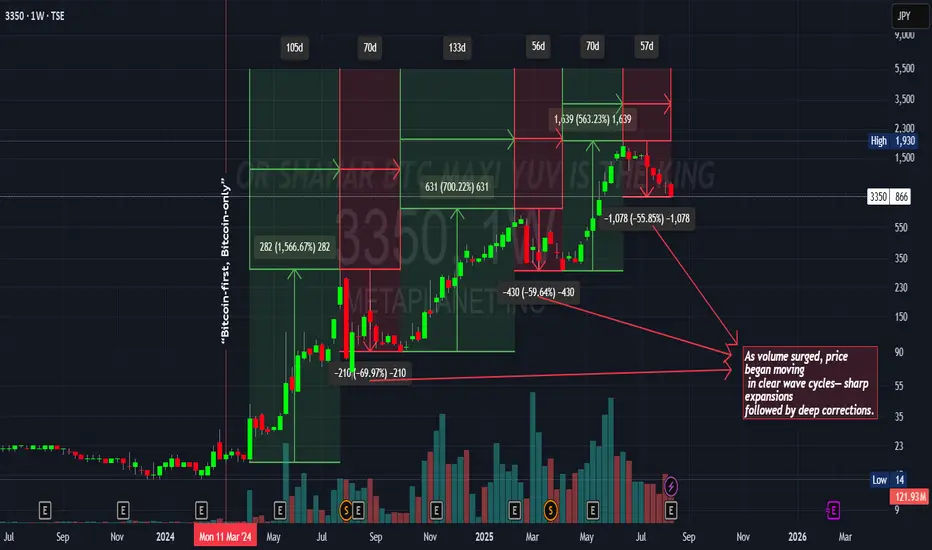
This chart highlights how price action developed in distinct wave cycles once volume surged.
Each expansion phase was sharp, delivering multi-hundred percent gains in relatively short periods.
These expansions were consistently followed by deep corrective pullbacks of 50–70%.
The repeating rhythm shows a market structure of accumulation → expansion → correction → continuation.
Overall, the cycles emphasize the importance of recognizing both momentum opportunities and the inevitable retracements that followed.
免责声明
这些信息和出版物并非旨在提供,也不构成TradingView提供或认可的任何形式的财务、投资、交易或其他类型的建议或推荐。请阅读使用条款了解更多信息。
免责声明
这些信息和出版物并非旨在提供,也不构成TradingView提供或认可的任何形式的财务、投资、交易或其他类型的建议或推荐。请阅读使用条款了解更多信息。