🧩 Overall Technical Analysis
Timeframe: Daily (1D)
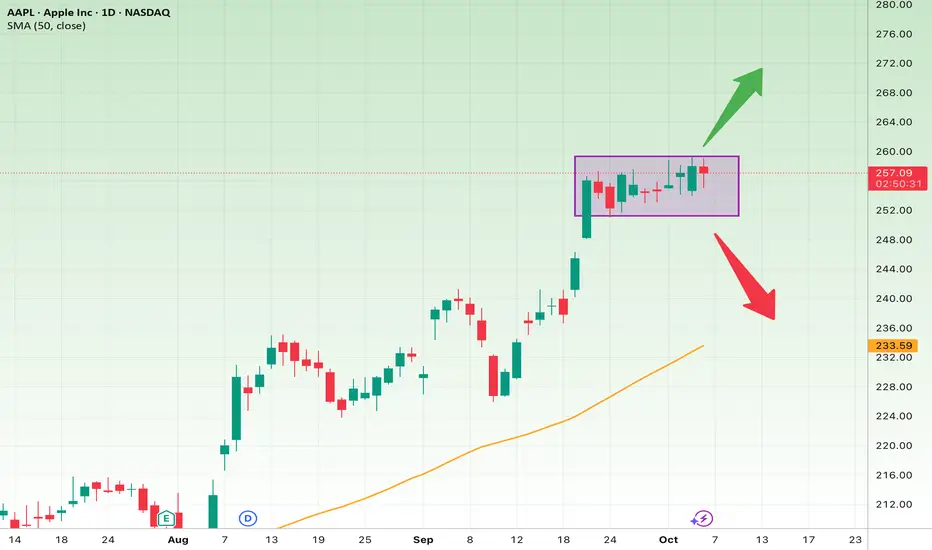
Current Situation: Price is consolidating in a narrow sideways range between $252 and $259, after a strong bullish rally — a typical bullish continuation pattern.
50-day SMA: Around $233.6, acting as a strong dynamic support.
Medium-term Trend: Uptrend (higher highs and higher lows since mid-September).
Pattern: Rectangular consolidation after a sharp move up — potential bullish flag formation.
⚡ Short-Term Outlook (1–2 Weeks)
The price is compressing between $252–$259, like a spring ready to break.
Bullish Scenario (Higher Probability)
Confirmation: Break and close above $260
Target 1: $268
Target 2: $275
Stop Loss: Daily close below $252
Bearish Scenario (Lower Probability)
Confirmation: Break and close below $252
Target 1: $243
Target 2: Around the 50-day SMA (~$233–$234)
Stop Loss: Daily close back above $258
📈 Short-term Summary:
As long as price stays above $252, the short-term bias remains bullish.
🏆 Long-Term Outlook (1–3 Months)
Primary Trend: Still bullish, supported by the 50-day SMA.
Market Structure: Higher highs and higher lows — classic uptrend continuation.
Potential next leg up if the price breaks convincingly above $260.
Long-Term Targets:
Target 1: $280 (psychological resistance & previous high zone)
Target 2: $295 (Fibonacci 1.272 extension from recent swing)
Long-Term Stop Loss:
Below $233 (loss of the 50-day SMA and break of bullish structure)
💡 Key Insights:
Watch for increasing volume and RSI momentum for confirmation of a breakout.
Keep an eye on upcoming earnings and product news — Apple’s sentiment can shift quickly.
A high-volume breakout above $260 would provide a stronger confirmation for continuation.
免责声明
这些信息和出版物并非旨在提供,也不构成TradingView提供或认可的任何形式的财务、投资、交易或其他类型的建议或推荐。请阅读使用条款了解更多信息。
免责声明
这些信息和出版物并非旨在提供,也不构成TradingView提供或认可的任何形式的财务、投资、交易或其他类型的建议或推荐。请阅读使用条款了解更多信息。