Apple is showing a potential bottom structure after rejecting the demand zone at the lower range.
Price bounced from the base and looks ready for a step-by-step move upward.
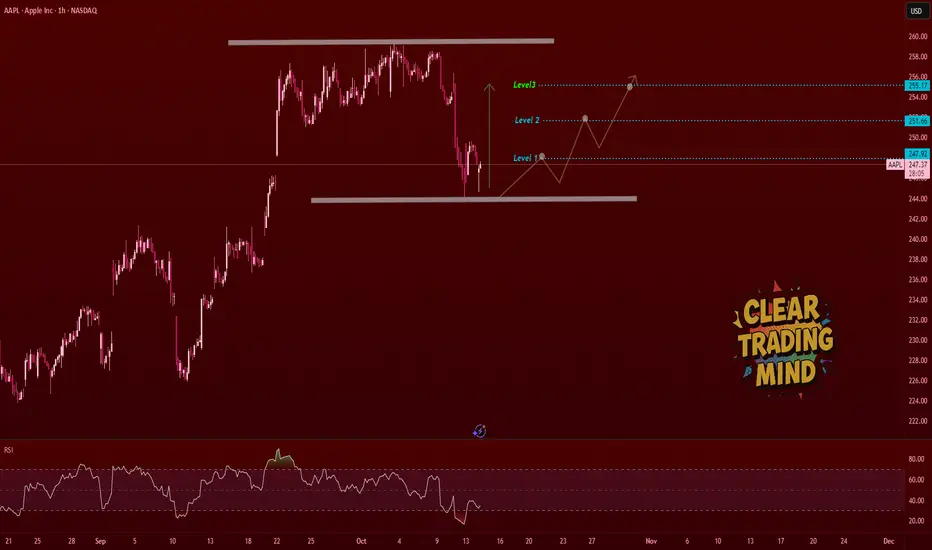
🔍 My Bullish Plan (1H Chart):
- As long as price holds the bottom range, I expect a recovery move.
- Watching price break each resistance step clearly:
🟢 Level 1 → 247.92
🟢 Level 2 → 251.66
🟢 Level 3 → 255.17
Once Level 1 breaks with strong momentum, I will look for intraday HL (higher low) or consolidation for continuation.
This zone looks good for scaling into bullish structure.
💡 Support Zone:
Marked demand base around 244.50 – strong previous reaction area.
⚠️ Invalidation:
If price fails to hold the demand zone and closes below the base, I’ll cancel the bullish bias.
🧠 Outlook Summary:
- RSI showing slight divergence hinting reversal strength
- Price at range low
- Multiple clean upside levels to work with
- Patience for breakout confirmation = key
Price bounced from the base and looks ready for a step-by-step move upward.
🔍 My Bullish Plan (1H Chart):
- As long as price holds the bottom range, I expect a recovery move.
- Watching price break each resistance step clearly:
🟢 Level 1 → 247.92
🟢 Level 2 → 251.66
🟢 Level 3 → 255.17
Once Level 1 breaks with strong momentum, I will look for intraday HL (higher low) or consolidation for continuation.
This zone looks good for scaling into bullish structure.
💡 Support Zone:
Marked demand base around 244.50 – strong previous reaction area.
⚠️ Invalidation:
If price fails to hold the demand zone and closes below the base, I’ll cancel the bullish bias.
🧠 Outlook Summary:
- RSI showing slight divergence hinting reversal strength
- Price at range low
- Multiple clean upside levels to work with
- Patience for breakout confirmation = key
免责声明
这些信息和出版物并非旨在提供,也不构成TradingView提供或认可的任何形式的财务、投资、交易或其他类型的建议或推荐。请阅读使用条款了解更多信息。
免责声明
这些信息和出版物并非旨在提供,也不构成TradingView提供或认可的任何形式的财务、投资、交易或其他类型的建议或推荐。请阅读使用条款了解更多信息。