📌 AAPL Analysis – 4H Timeframe
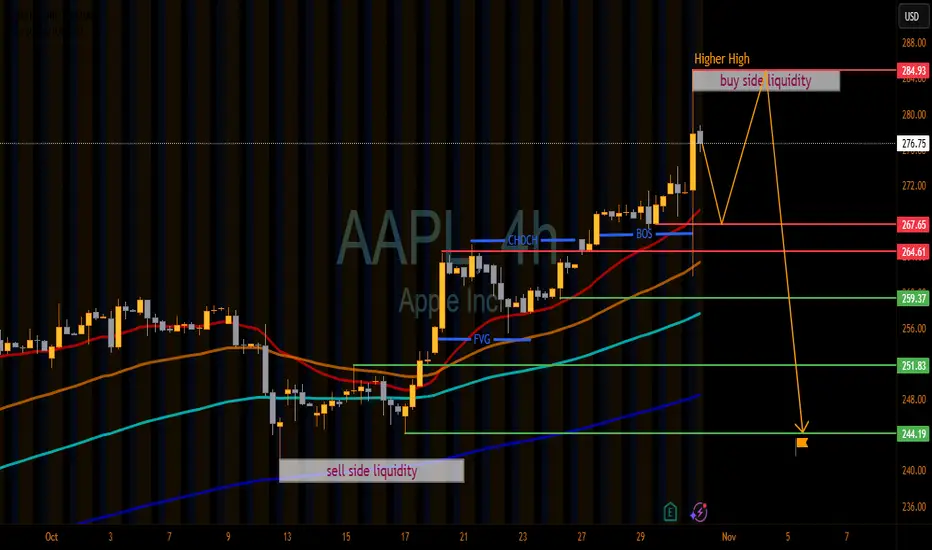
By analyzing the AAPL chart on the 4-hour timeframe, we can see that after taking Buy-Side Liquidity near 284.93 and forming a Higher High, price is showing signs of a potential reaction from this zone.
If Apple fails to break and sustain above this level, we may see a short-term pullback toward the support area at 267.65 – 264.61.
A strong break below this zone could open the way for a deeper decline toward 259.37 and even 251.83.
The major downside liquidity target remains around 244.19, where we expect buyers to step back in.
This analysis will be updated soon!
Please support me with your likes and comments to motivate me to share more analysis with you and share your opinion about the possible trend of this chart with me!
Best Regards,
HoneySpotTrading
交易开始
Join My Telegram Channel Link 👇
t.me/honeymarketinsighter
Join My Refferel Broker Link 👇
one.exnessonelink.com/a/uvd1etcgg1
Refferel code 👇
uvd1etcgg1
t.me/honeymarketinsighter
Join My Refferel Broker Link 👇
one.exnessonelink.com/a/uvd1etcgg1
Refferel code 👇
uvd1etcgg1
相关出版物
免责声明
这些信息和出版物并不意味着也不构成TradingView提供或认可的金融、投资、交易或其它类型的建议或背书。请在使用条款阅读更多信息。