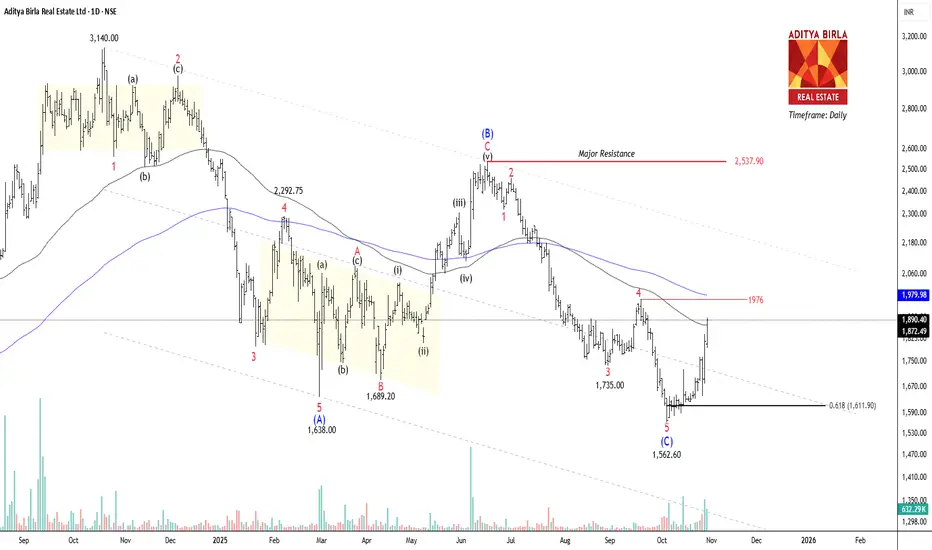
NSE ABREL has constructed a corrective A-B-C formation on the daily timeframe chart. The price has fallen 50% from the all-time high of 3410 within 13 months. Wave (B) occurred at 2537.9, where Wave (c) completed the 5-wave cycle at 1635. If the price breaks and closes above 1976, traders can buy for the following targets: 2080 – 2140 – 2185+.
Why can’t we label it early?
We can assume wave (C) is 100% agreed upon without any confirmation. It can be a huge mistake if the price falls below 1880 again; this could signal a complex corrective extension.
Our targets are up to the upper band only because the alternate count says this bounce might still be a wave 4. The move is sharp, but corrective wave 4 rallies often look impulsive.
The trend remains down until the channel is broken.
Important Factors:
Volume Analysis:
Volume on the latest bars is increasing, but not enough to scream “trend reversal”. We need a volume breakout, not just price.
Failure Zone:
Rejection at 1976 = Ugly pullback to 1730 -1700.
Invalidation:
Closing below the Fibonacci retracement 0.618 at 1611 will make this count invalid due to the formation of new lower lows.
Alternative count:
We will look for one more downward move of the ending diagonal (Wave E) before printing the bottom!
免责声明
这些信息和出版物并非旨在提供,也不构成TradingView提供或认可的任何形式的财务、投资、交易或其他类型的建议或推荐。请阅读使用条款了解更多信息。
免责声明
这些信息和出版物并非旨在提供,也不构成TradingView提供或认可的任何形式的财务、投资、交易或其他类型的建议或推荐。请阅读使用条款了解更多信息。