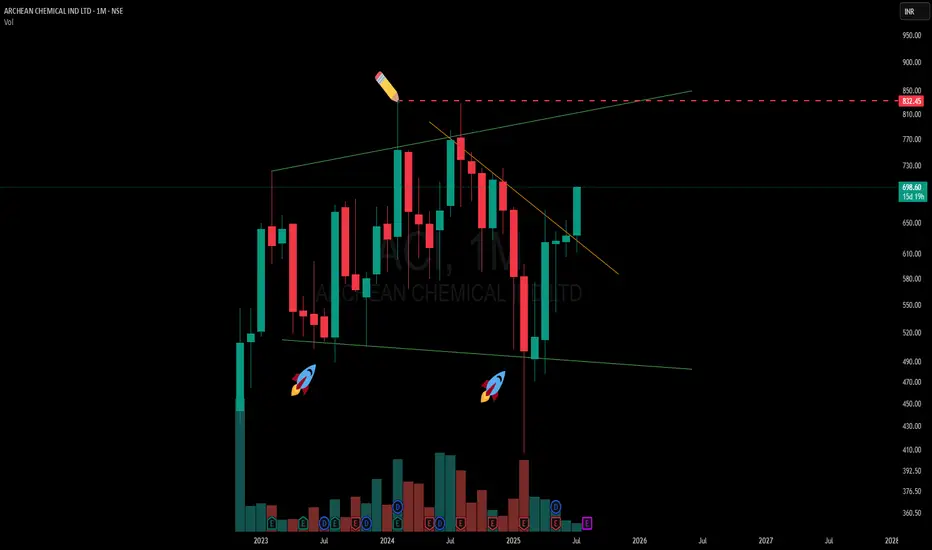
🟢A classic case of a broadening formation playing out on the higher timeframe (MTF). The green lines represent the broadening range, with price recently respecting the lower boundary — evident from the two support touches marked with 🚀 icons, each forming slightly lower lows before rebounding.
🟢 The current candle is testing a counter-trend (CT) descending trendline breakout, visible clearly after a prolonged series of lower highs. While the candle is still in progress and hasn’t closed, the structure is showing signs of compression toward the mid-zone of the broadening pattern.
📌 Upper and lower spaces remain open, highlighting the broad-range volatility typical of this setup.
No forecast — just structure. 📊
🎯 Master My Self-Made Trading Strategy
📈 Telegram (Learn Today): t.me/hashtaghammer
✅ WhatsApp (Learn Today): wa.me/919455664601
📈 Telegram (Learn Today): t.me/hashtaghammer
✅ WhatsApp (Learn Today): wa.me/919455664601
相关出版物
免责声明
这些信息和出版物并非旨在提供,也不构成TradingView提供或认可的任何形式的财务、投资、交易或其他类型的建议或推荐。请阅读使用条款了解更多信息。