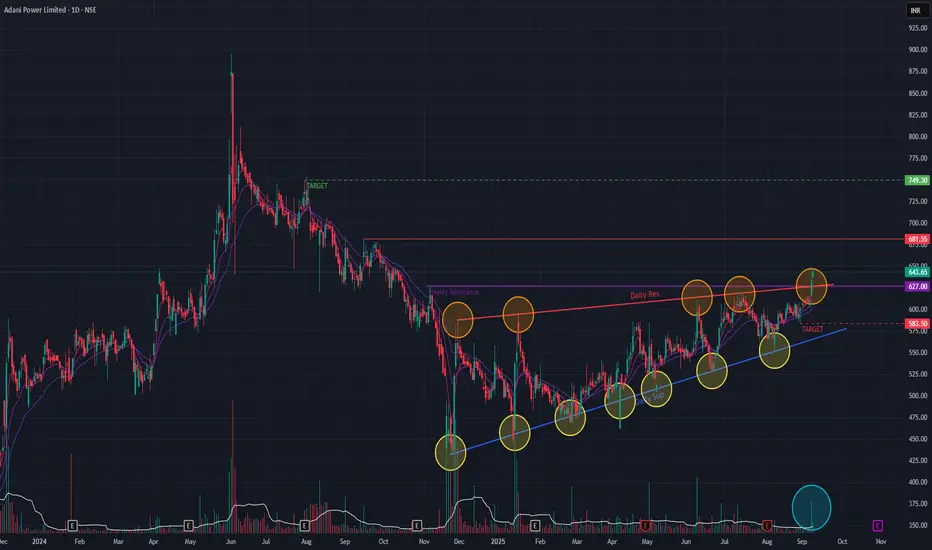
Adani Power has been in an uptrend since Nov 2024 & has formed a Triangle pattern. The past two days it has BrokenOut of the Triangle pattern with exceptionally huge volume indicating buyer interest. Short-term EMAs are in PCO state as well as the stock has breached two major resistance trendlines asserting Bullishness. A Golden Cross-over has formed since few days, indicating Bullishness
We may see levels of 749 if the momentum continues as well as a major resistance trendline is breached. It may go down to 583 levels if momentum is not sustained.
Keep monitoring the price-action !!
We may see levels of 749 if the momentum continues as well as a major resistance trendline is breached. It may go down to 583 levels if momentum is not sustained.
Keep monitoring the price-action !!
Disclaimer: This analysis is my personal view & for educational purposes only. They shall not be construed as trade or investment advice. Before making any financial decision, it is imperative that you consult with a qualified financial professional.
免责声明
The information and publications are not meant to be, and do not constitute, financial, investment, trading, or other types of advice or recommendations supplied or endorsed by TradingView. Read more in the Terms of Use.