Hello all, Happy Monday and I hope that all of you will have a very great week. Although we've seen the 6% drop on the last day of last week, I'm sure that all of us will have our best days again. Here I come with an update of bitcoin's daily view after the weekly candle closed.
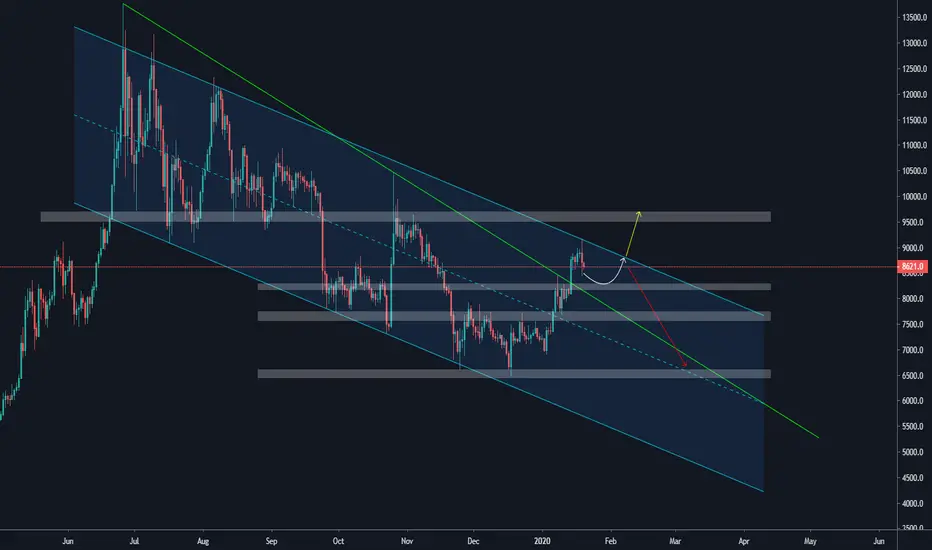
From the chart attached, I've found some levels that might be very interesting for bitcoin (look at the gray zones). All the levels that I've marked are having confluences with the previous price action and other factors affect it. Right now the price is moving sideway after entering the $8500 - $8650 region which acts as a support too. If the price can moves below the $8500 region, we might see the price to drop further to the $8290 region.
So far, the down trend channel still holds the price and is still valid. Now, the upper line of the channel will be considered as a strong resistance.
2 possible scenarios
And these are the 2 possible scenarios that will likely occur on the bitcoin's price :
1. The price touch the $8290 region and considering this region is having a confluence with the green line which also consider as previous broken resistance which is now become support. Then we will see the price bounce from this area and break out of the resistance trend line.
2. The price keeps breaking down to the lower structure and my previous wave count remains valid.
I'll wait patiently how the price reacts when it touches the key levels I've mentioned.
相关出版物
免责声明
这些信息和出版物并不意味着也不构成TradingView提供或认可的金融、投资、交易或其它类型的建议或背书。请在使用条款阅读更多信息。