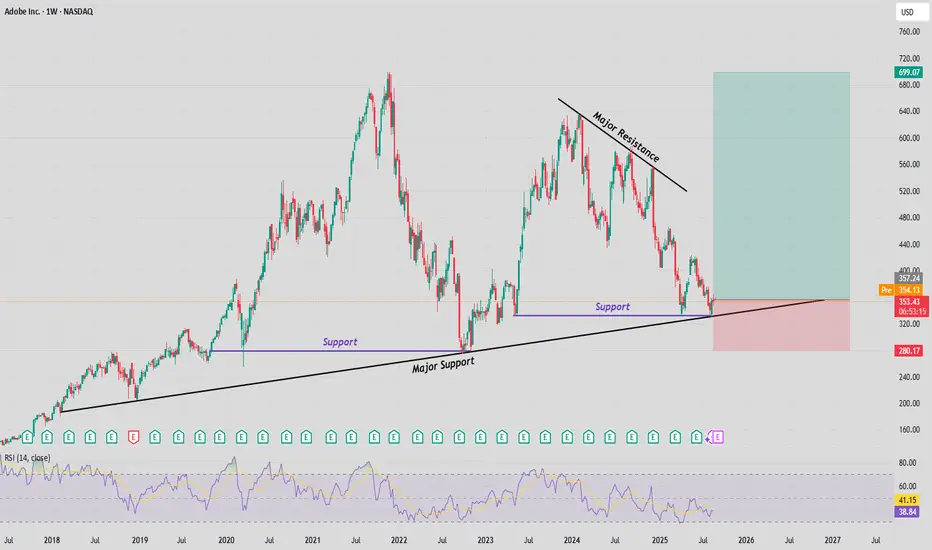
ADBE continues to trade within a broad descending channel while maintaining contact with its long-term ascending support trendline.
Price recently retested the major horizontal support near $330 — a level that has acted as a critical demand zone multiple times in the past — and responded with a notable bounce, reflecting renewed buying pressure and potential accumulation.
If this recovery holds, price action could gravitate toward the descending resistance trendline, with a primary upside target around $639, which aligns with prior swing highs and the upper boundary of the channel.
The RSI is recovering from mid-range levels, suggesting there is still upside momentum potential before entering overbought territory. Sustained strength above $350–$360 would further validate the bullish bias and may attract additional momentum buyers.
Conversely, a decisive breakdown below $330 and the ascending trendline would invalidate the current structure and expose the stock to deeper downside risk toward the $280 region.ear.
免责声明
这些信息和出版物并不意味着也不构成TradingView提供或认可的金融、投资、交易或其它类型的建议或背书。请在使用条款阅读更多信息。