Hey traders! I recently spotted something very interesting on the charts that could potentially signal a high-probability bullish setup. Let’s break it down in a simple yet professional way — so even if you’re new to price action, you’ll understand exactly what’s happening here.
📊 Multi–Timeframe Analysis Breakdown ⚡
Daily Timeframe Insight 🔍
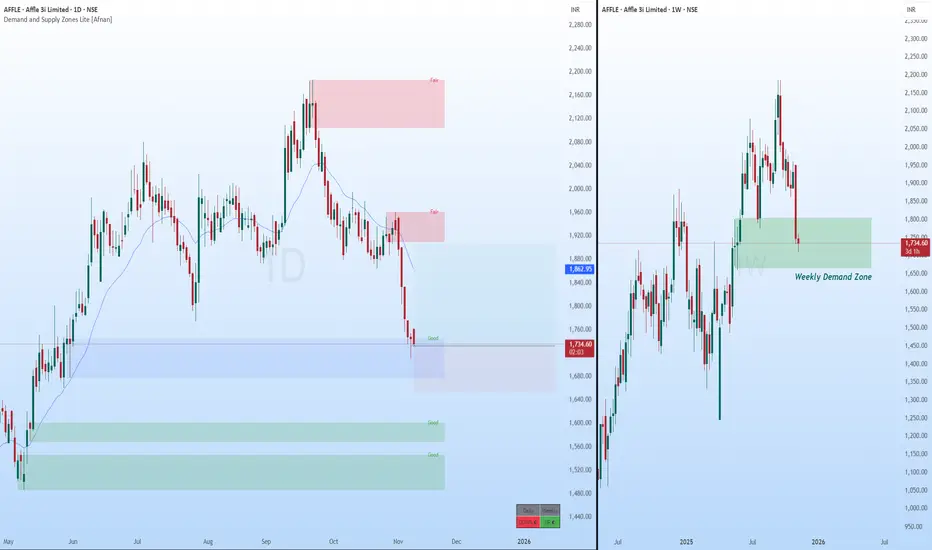
Price is currently sitting inside a Daily Rally–Base–Rally (RBR) Demand Zone — and not just any zone, it’s a fresh, Good-quality demand zone. This means that institutional orders likely remain pending here, waiting for price to revisit.
Importantly, there’s no nearby supply zone until a 1:2 RR level, which gives the trade enough breathing space for a smooth upside move.
This zone also carries achievement strength, as it previously broke a supply zone and pushed price to a new all-time high (ATH) — a sign that big players were in control during that move.
Weekly Timeframe Context ⏳
Zooming out, the weekly trend is still bullish. We can clearly see price returning to a weekly demand zone that also has an achievement — it broke prior supply and established the recent ATH.
The retracement happening now is part of a healthy market structure — a pullback into institutional demand for re-accumulation before the next leg higher.
Even better, there’s no higher timeframe supply zone overhead, which means price is free to expand upward without major resistance.
🔥 What Does This Mean for Traders? 💡
🚦 Possible Trading Approach (Educational Perspective) 🧭
This setup aligns perfectly with curve analysis principles, as price is trading low on the curve in an uptrend — a classic condition for demand-based entries.
💬 Final Thoughts 🚀
Trading is all about alignment — when trend, structure, and institutional footprints come together, the market often rewards patience.
“The best trades are born where patience meets preparation.”
Lastly, Thank you for your support, your likes & comments. Feel free to ask if you have questions. 💬
Stay focused, stay disciplined — and remember, every chart tells a story! 📊✨
📜 Disclaimer ⚠️
This analysis is purely for educational purposes only. It should not be considered as trading or investment advice. I am not a SEBI registered analyst.
📊 Multi–Timeframe Analysis Breakdown ⚡
Daily Timeframe Insight 🔍
Price is currently sitting inside a Daily Rally–Base–Rally (RBR) Demand Zone — and not just any zone, it’s a fresh, Good-quality demand zone. This means that institutional orders likely remain pending here, waiting for price to revisit.
Importantly, there’s no nearby supply zone until a 1:2 RR level, which gives the trade enough breathing space for a smooth upside move.
This zone also carries achievement strength, as it previously broke a supply zone and pushed price to a new all-time high (ATH) — a sign that big players were in control during that move.
Weekly Timeframe Context ⏳
Zooming out, the weekly trend is still bullish. We can clearly see price returning to a weekly demand zone that also has an achievement — it broke prior supply and established the recent ATH.
The retracement happening now is part of a healthy market structure — a pullback into institutional demand for re-accumulation before the next leg higher.
Even better, there’s no higher timeframe supply zone overhead, which means price is free to expand upward without major resistance.
🔥 What Does This Mean for Traders? 💡
- Price is reacting from a Daily RBR Demand Zone aligned with Weekly Demand.
- Trend Direction: Weekly trend is up, Daily structure supports a continuation.
- Risk-Reward Outlook: Clean room till 1:2 RR, minimal supply interference.
- Institutional Confluence: Both zones are achievement zones — confirming strong prior institutional participation.
- Market Psychology: After creating new highs, the pullback likely represents smart money accumulation, not distribution.
🚦 Possible Trading Approach (Educational Perspective) 🧭
- Entry Zone: Around the proximal line of Daily RBR demand
- Stop-Loss: Just below the distal line of the demand zone
- Target: 1:2 RR or next visible supply zone on the Daily timeframe
- Trade Type: Set & Forget or Confirmation-based
This setup aligns perfectly with curve analysis principles, as price is trading low on the curve in an uptrend — a classic condition for demand-based entries.
💬 Final Thoughts 🚀
Trading is all about alignment — when trend, structure, and institutional footprints come together, the market often rewards patience.
“The best trades are born where patience meets preparation.”
Lastly, Thank you for your support, your likes & comments. Feel free to ask if you have questions. 💬
Stay focused, stay disciplined — and remember, every chart tells a story! 📊✨
📜 Disclaimer ⚠️
This analysis is purely for educational purposes only. It should not be considered as trading or investment advice. I am not a SEBI registered analyst.
Access the powerful Demand and Supply Zone Pro indicator at:
marketup2date.com
Stay updated on Telegram:
t.me/MarketUp2Date
Join our WhatsApp channel:
whatsapp.com/channel/0029Va6ByyH0LKZCc4Az4x0u
marketup2date.com
Stay updated on Telegram:
t.me/MarketUp2Date
Join our WhatsApp channel:
whatsapp.com/channel/0029Va6ByyH0LKZCc4Az4x0u
相关出版物
免责声明
这些信息和出版物并非旨在提供,也不构成TradingView提供或认可的任何形式的财务、投资、交易或其他类型的建议或推荐。请阅读使用条款了解更多信息。