1️⃣ Multi-Timeframe (MTF) View
Timeframe Trend Demand Zone (Proximal–Distal) Avg Zone
Yearly / 6-Month UP 1511–871 1191
Quarterly UP 1394–1312 1353
Monthly UP 1800–1730 1765
Weekly UP 1959–1872 1916
Daily UP 1954–1872 1913
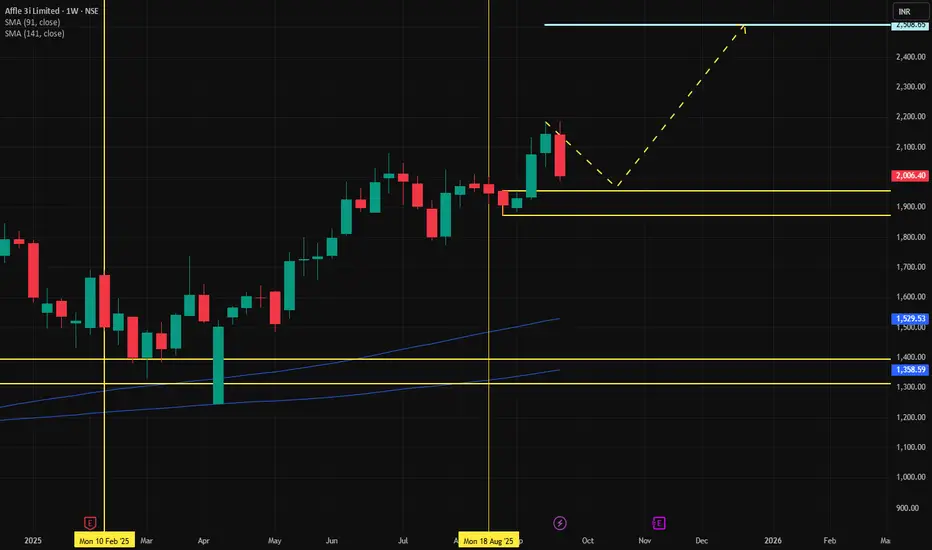
Takeaway: Clear UP trend on all higher timeframes; current daily/weekly demand sits around 1870–1959.
2️⃣ Intraday / ITF Zones
Interval Zone Avg
240m 1908–1805 1857
180m 1908–1805 1857
60m 1894–2034 1964
Takeaway: Strong confluence of support in the 1800–1900 area; upside levels extend beyond 2000.
3️⃣ Trade Setup
Entry: 1954
Stop-loss (SL): 1870
Target: 2593
Risk per share: 84
Reward per share: 639
Risk/Reward ratio: ~7.6
Capital Required (65% MTF): ₹2.93M
Qty: 1500 shares
Takeaway: Excellent RR (≥7) with SL below demand zone.
4️⃣ Financials
Profit if target hit: ~₹9.58 lakh gross / ~₹9.36 lakh net
Loss if SL hit: ~₹1.26 lakh gross / ~₹1.48 lakh net
ROI over 4 months: ~54% (annualised much higher)
5️⃣ Key Levels
Immediate Support: 1870–1910 (Gann low & SL area)
Immediate Resistance / Target Zone: 2593 (with upside potential if momentum continues)
Gann Point High: 1967 confirms uptrend
6️⃣ Risk Management Pointers
You’re allocating ~65% capital — strong conviction but ensure you’re comfortable with exposure.
Given RR>6, you could also scale in: e.g., 50% at 1954, 50% on breakout above 1967.
Keep reviewing fundamental catalysts or volume patterns to validate price action.
Monitor trailing stops once price crosses 2100+ to lock in gains.
Timeframe Trend Demand Zone (Proximal–Distal) Avg Zone
Yearly / 6-Month UP 1511–871 1191
Quarterly UP 1394–1312 1353
Monthly UP 1800–1730 1765
Weekly UP 1959–1872 1916
Daily UP 1954–1872 1913
Takeaway: Clear UP trend on all higher timeframes; current daily/weekly demand sits around 1870–1959.
2️⃣ Intraday / ITF Zones
Interval Zone Avg
240m 1908–1805 1857
180m 1908–1805 1857
60m 1894–2034 1964
Takeaway: Strong confluence of support in the 1800–1900 area; upside levels extend beyond 2000.
3️⃣ Trade Setup
Entry: 1954
Stop-loss (SL): 1870
Target: 2593
Risk per share: 84
Reward per share: 639
Risk/Reward ratio: ~7.6
Capital Required (65% MTF): ₹2.93M
Qty: 1500 shares
Takeaway: Excellent RR (≥7) with SL below demand zone.
4️⃣ Financials
Profit if target hit: ~₹9.58 lakh gross / ~₹9.36 lakh net
Loss if SL hit: ~₹1.26 lakh gross / ~₹1.48 lakh net
ROI over 4 months: ~54% (annualised much higher)
5️⃣ Key Levels
Immediate Support: 1870–1910 (Gann low & SL area)
Immediate Resistance / Target Zone: 2593 (with upside potential if momentum continues)
Gann Point High: 1967 confirms uptrend
6️⃣ Risk Management Pointers
You’re allocating ~65% capital — strong conviction but ensure you’re comfortable with exposure.
Given RR>6, you could also scale in: e.g., 50% at 1954, 50% on breakout above 1967.
Keep reviewing fundamental catalysts or volume patterns to validate price action.
Monitor trailing stops once price crosses 2100+ to lock in gains.
免责声明
这些信息和出版物并不意味着也不构成TradingView提供或认可的金融、投资、交易或其它类型的建议或背书。请在使用条款阅读更多信息。