⚡ ALB Technical Outlook – Symmetrical Triangle at Key Inflection
Ticker: ALB (Albemarle Corp.)
Timeframe: 30-minute candles
🔍 Current Setup
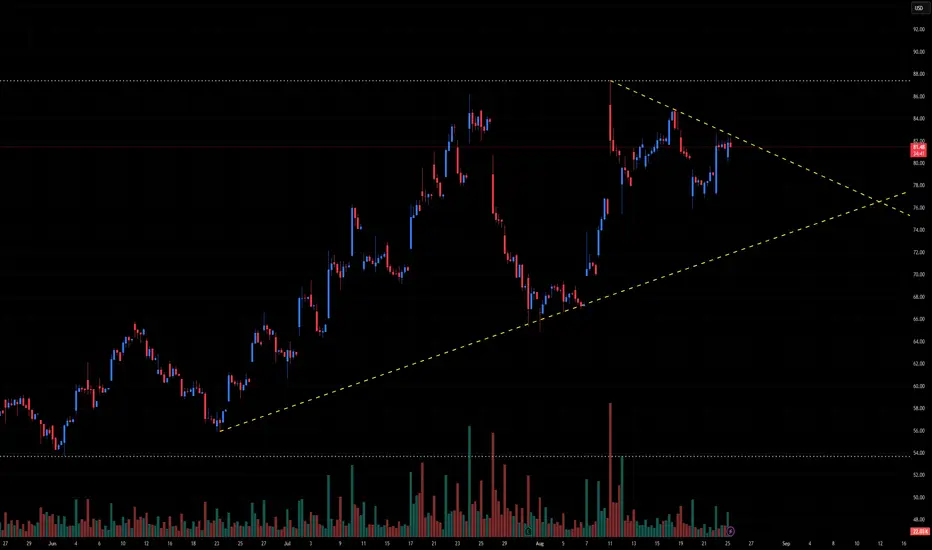
ALB has been in a long-term uptrend, holding an ascending support trendline since late June. After peaking near ~87, price has pulled back and is now consolidating within a symmetrical triangle.
Descending resistance: ~84–85.
Ascending support: ~76–77.
Current price: ~81.40, sitting inside the triangle and nearing the apex.
This structure reflects compression — energy building for a decisive breakout.
📊 Breakout Levels
🚀 Upside (Bullish Scenario)
Trigger: Break and close above 85.
Intermediate Targets:
87–88 → Prior swing high.
90+ → Psychological round number.
Measured Move Target: ~92–94 (triangle height projection).
🔻 Downside (Bearish Scenario)
Trigger: Break below 77, confirmation under 76.
Intermediate Supports:
74–73 → First demand zone.
70–68 → Stronger support.
Measured Move Target: ~67 (triangle height projection downward).
📈 Volume Analysis
Volume has been declining during the triangle formation — normal for consolidation.
Expect a sharp volume expansion once price escapes the triangle.
⚖️ Probability Bias
The broader trend has been upward, which slightly favors a bullish continuation if resistance at 85 is cleared.
However, a failure below 76–77 would invalidate the bullish structure and trigger a breakdown.
✅ Takeaway
ALB is at a critical decision point within a symmetrical triangle:
Bullish Break > 85: Targets 88 → 90 → 92–94
Bearish Break < 76–77: Targets 74 → 70 → 67
The breakout direction — confirmed by volume — will likely define ALB’s next major move.
Ticker: ALB (Albemarle Corp.)
Timeframe: 30-minute candles
🔍 Current Setup
ALB has been in a long-term uptrend, holding an ascending support trendline since late June. After peaking near ~87, price has pulled back and is now consolidating within a symmetrical triangle.
Descending resistance: ~84–85.
Ascending support: ~76–77.
Current price: ~81.40, sitting inside the triangle and nearing the apex.
This structure reflects compression — energy building for a decisive breakout.
📊 Breakout Levels
🚀 Upside (Bullish Scenario)
Trigger: Break and close above 85.
Intermediate Targets:
87–88 → Prior swing high.
90+ → Psychological round number.
Measured Move Target: ~92–94 (triangle height projection).
🔻 Downside (Bearish Scenario)
Trigger: Break below 77, confirmation under 76.
Intermediate Supports:
74–73 → First demand zone.
70–68 → Stronger support.
Measured Move Target: ~67 (triangle height projection downward).
📈 Volume Analysis
Volume has been declining during the triangle formation — normal for consolidation.
Expect a sharp volume expansion once price escapes the triangle.
⚖️ Probability Bias
The broader trend has been upward, which slightly favors a bullish continuation if resistance at 85 is cleared.
However, a failure below 76–77 would invalidate the bullish structure and trigger a breakdown.
✅ Takeaway
ALB is at a critical decision point within a symmetrical triangle:
Bullish Break > 85: Targets 88 → 90 → 92–94
Bearish Break < 76–77: Targets 74 → 70 → 67
The breakout direction — confirmed by volume — will likely define ALB’s next major move.
免责声明
这些信息和出版物并不意味着也不构成TradingView提供或认可的金融、投资、交易或其它类型的建议或背书。请在使用条款阅读更多信息。
免责声明
这些信息和出版物并不意味着也不构成TradingView提供或认可的金融、投资、交易或其它类型的建议或背书。请在使用条款阅读更多信息。