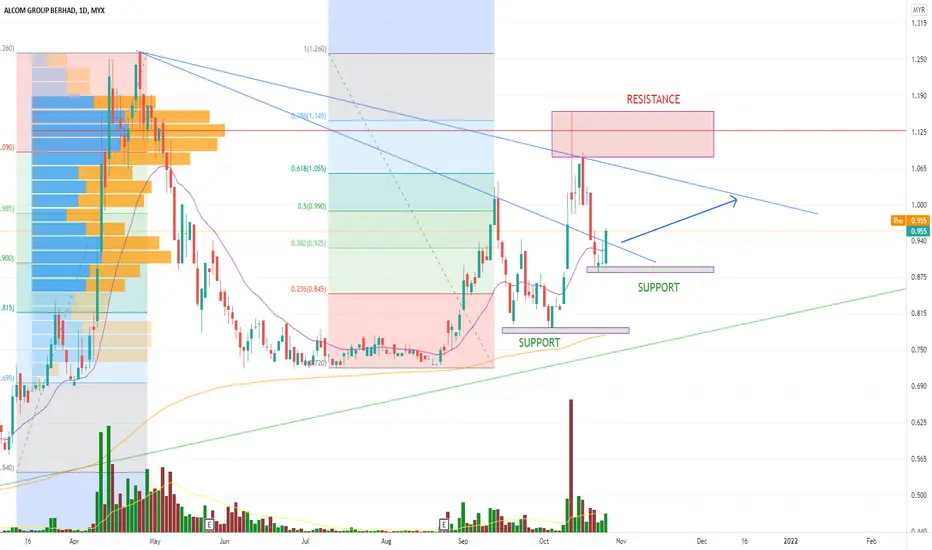
Technical analysis for ALCOM Stock based on Trend Analysis, Chart Pattern and Fibonacci Retracement
注释
Current price candle has break the immediate support line. Price candle 8 Nov 21 show Demand Test Candle with low volume-positive result. Price may move lower to next support line at 0.790.交易结束:到达止损
This stock lost momentum, don' take position in this stockAHI
免责声明
这些信息和出版物并不意味着也不构成TradingView提供或认可的金融、投资、交易或其它类型的建议或背书。请在使用条款阅读更多信息。
AHI
免责声明
这些信息和出版物并不意味着也不构成TradingView提供或认可的金融、投资、交易或其它类型的建议或背书。请在使用条款阅读更多信息。