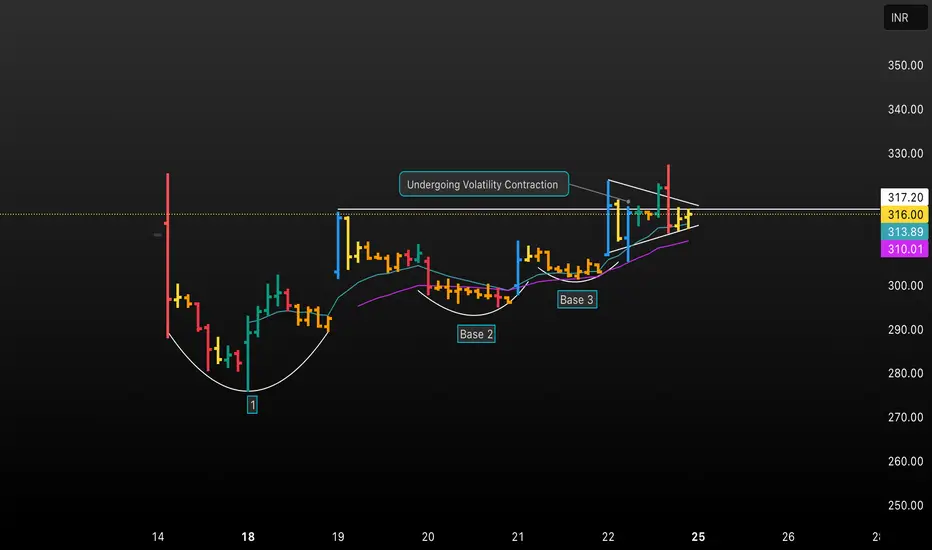
Unlock a detailed analysis of volatility contraction in this TradingView chart! Discover how price stabilizes through three distinct bases, undergoes steady consolidation, and prepares for a breakout. This educational chart highlights key phases, trendlines, and technical signals to help traders identify high-probability entry points using volatility contraction patterns. Ideal for those seeking actionable insights and trading strategy refinement.
免责声明
这些信息和出版物并不意味着也不构成TradingView提供或认可的金融、投资、交易或其它类型的建议或背书。请在使用条款阅读更多信息。
免责声明
这些信息和出版物并不意味着也不构成TradingView提供或认可的金融、投资、交易或其它类型的建议或背书。请在使用条款阅读更多信息。