🔎 Technical Analysis (Based on the Chart)
Recent Trend:
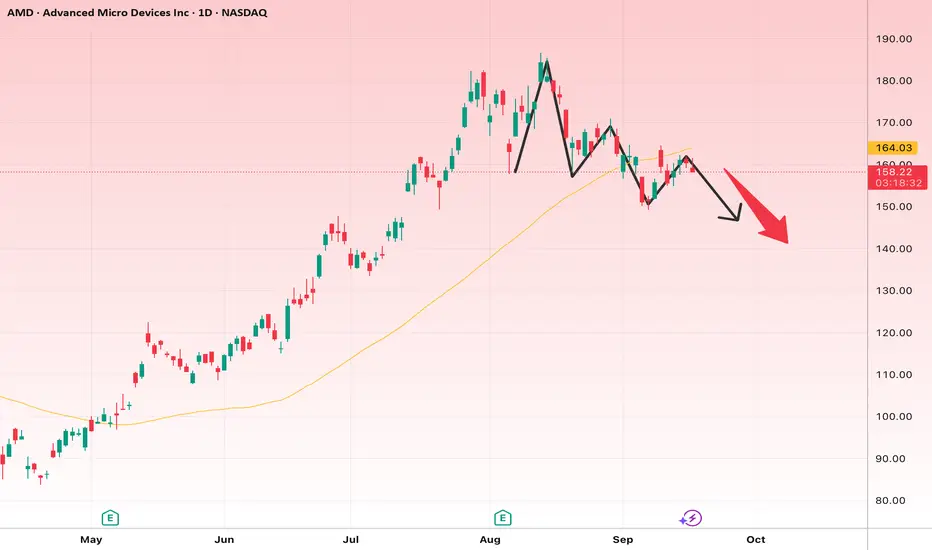
After a sharp rally from around $100 to nearly $180, the stock entered a corrective phase.
A series of lower highs and lower lows suggests the start of a short-term downtrend.
Price is now trading below the 50-day moving average (yellow line), which is a bearish signal.
Patterns & Price Action:
The chart shows a possible Head & Shoulders structure or at least a similar bearish formation.
The red arrow indicates potential downside movement toward lower levels.
📉 Short-Term Outlook (2–6 weeks)
Bias: Bearish
Targets:
First target: $150
Second target: $140 (if support breaks)
Stop-loss: A confirmed close above $166–168 (back above the moving average and resistance).
📈 Long-Term Outlook (3–6 months)
If the current correction extends, the stock could dip toward $135–140, then potentially start a new bullish phase.
Upside Targets:
First target: $180 retest
Second target: $200–210 if the historical high breaks
Stop-loss (long-term): A confirmed close below $135 (break of major support, trend reversal to bearish).
✅ Summary:
Short-term: Likely correction toward $150–140.
Long-term: As long as $135 holds, bullish targets toward $200 remain valid.
免责声明
这些信息和出版物并不意味着也不构成TradingView提供或认可的金融、投资、交易或其它类型的建议或背书。请在使用条款阅读更多信息。
免责声明
这些信息和出版物并不意味着也不构成TradingView提供或认可的金融、投资、交易或其它类型的建议或背书。请在使用条款阅读更多信息。