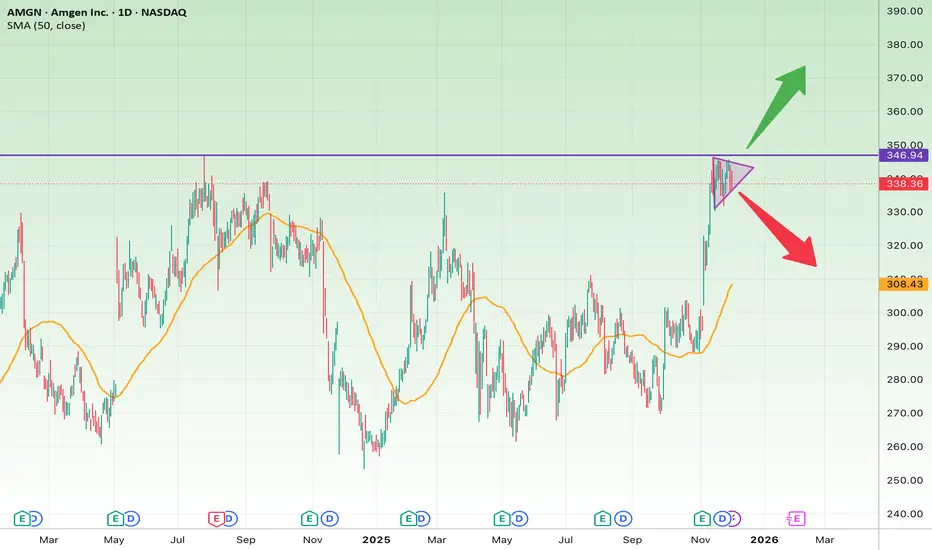
1. Technical Analysis
AMGN has formed a bullish pennant pattern after a strong upside rally. This compression typically acts as a continuation setup, suggesting that buyers are preparing for another push higher—if the major resistance gives way.
Key Resistance
• $346.7 → Major multi-year resistance
Bullish Scenario
If AMGN breaks above 346.7:
• Target 1: $360
• Target 2: $370
• Target 3: $385
Bullish catalysts:
• Strong prior momentum
• Bullish Pennant continuation pattern
• Trading well above the 50-day SMA
Bearish Scenario
If price breaks below the pennant support:
• Support 1: $330
• Support 2: $318
• Support 3: 50-day SMA (~$308)
Suggested Stop-Loss
For short-term traders:
• Stop-Loss: A confirmed break below $330
(A close below 330 indicates weakness and invalidation of the pennant.)
For swing/mid-term traders:
• Stop-Loss (safer): $318
(Losing this level breaks the broader bullish structure.)
2. Fundamental Snapshot
Positives
• Strong revenue performance in specialty therapeutics
• Recent earnings beat expectations
• Healthy cash flow and margins
• Expanding R&D pipeline and new partnerships
Risks
• Intense competition within biotech
• Price-pressure risks
• Regulatory and FDA-related uncertainties
Summary:
The fundamentals remain strong and support the bullish technical structure unless major negative catalysts emerge.
3. Final Summary
AMGN is sitting at a critical inflection point.
A breakout above 346.7 could trigger a new bullish leg, while weakness below 330 activates the stop-loss for short-term traders.
免责声明
这些信息和出版物并非旨在提供,也不构成TradingView提供或认可的任何形式的财务、投资、交易或其他类型的建议或推荐。请阅读使用条款了解更多信息。
免责声明
这些信息和出版物并非旨在提供,也不构成TradingView提供或认可的任何形式的财务、投资、交易或其他类型的建议或推荐。请阅读使用条款了解更多信息。