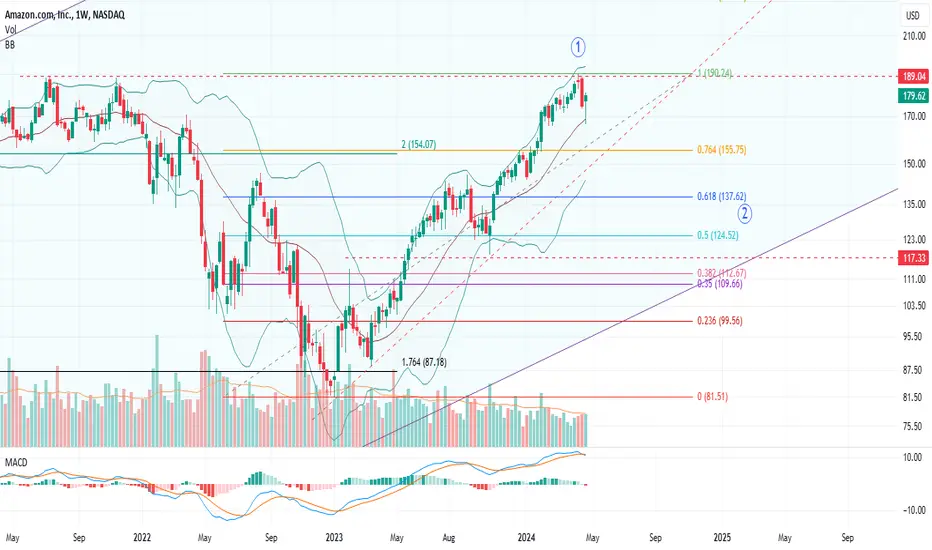
Last week's candle seemed like the Amazon ride might be over for good. This week bulls attempt a heroic reversal. Test on weekly 20 EMA/ mid Bollinger band and getting support there is kind of a big deal. However, there is a MACD bearish cross on the weekly, along with resistance right on the mid Bollinger band on the daily time frame (not on this chart, but it is there). On lower time frame it looks like a 3 wave correction has completed last week, but it looks disproportionately small for being a primary degree correction. So my thesis for now is, either this is intermediate degree wave 4 correction and there will be one more high (and an all time high) incoming, or this is an A wave of some degree and it will be slow downward movement from here. For wave 2 correction, there are several support area targets. First on the market structure at 0.618 fib retrace at around $137 then somewhere between 0.5 and 0.38 fib retrace area $124- $112. On the upside, if we do see another high, the target would be somewhere between $214- $234 (other fib levels from various swings). Right now, waiting to see the current range ($190 - $165) to break before placing my bets...
免责声明
这些信息和出版物并非旨在提供,也不构成TradingView提供或认可的任何形式的财务、投资、交易或其他类型的建议或推荐。请阅读使用条款了解更多信息。