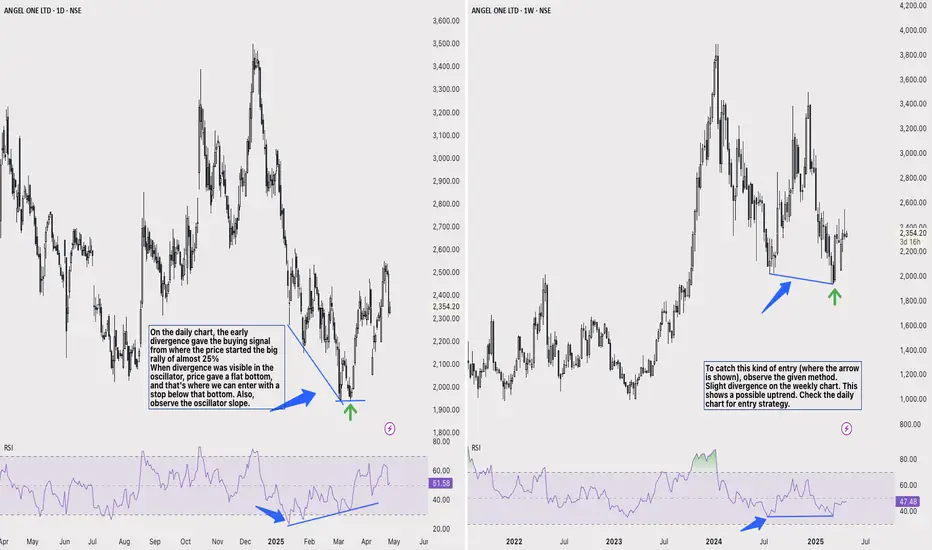
Observe the given method to catch this kind of entry (where the arrow is shown).
Slight divergence on the weekly chart. This shows a possible uptrend. Check the daily chart for entry strategy.
On the daily chart, the early divergence gave the buying signal from where the price started the big rally of almost 25%
When divergence was visible in the oscillator, price gave a flat bottom, and that's where we can enter with a stop below that bottom. Also, observe the oscillator slope,it is making higher high and price making lower low and before the rally it gave flat price action.
absoluteanalysis.in
whatsapp channel: whatsapp.com/channel/0029VanXIFTAzNbzxU4hF62L
whatsapp channel: whatsapp.com/channel/0029VanXIFTAzNbzxU4hF62L
免责声明
这些信息和出版物并不意味着也不构成TradingView提供或认可的金融、投资、交易或其它类型的建议或背书。请在使用条款阅读更多信息。
免责声明
这些信息和出版物并不意味着也不构成TradingView提供或认可的金融、投资、交易或其它类型的建议或背书。请在使用条款阅读更多信息。