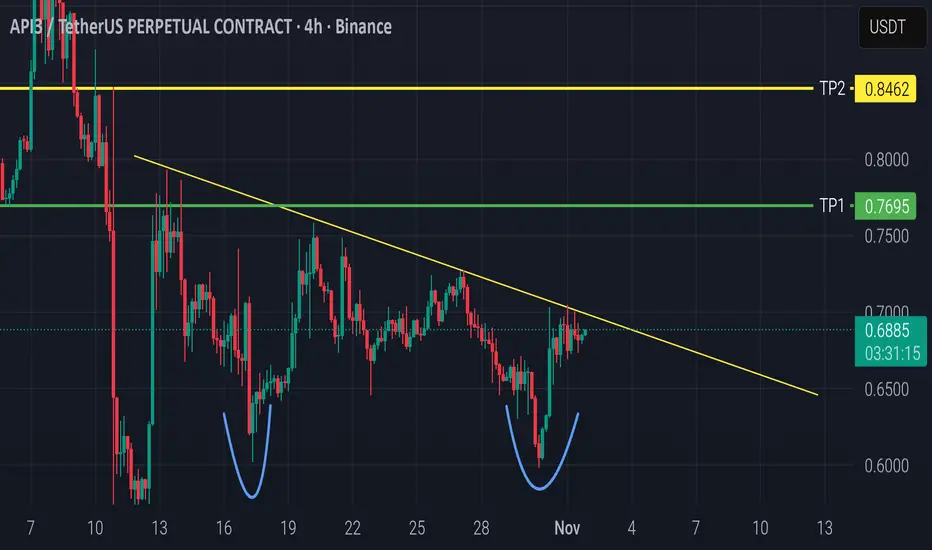
The chart shows a clear Double Bottom pattern around the 0.60 zone, indicating a potential bullish reversal.
Price is now testing the descending trendline (neckline), and a confirmed 4H candle close above 0.69 with strong volume could trigger a breakout move.
🎯 Targets:
TP1: 0.7412
TP2: 0.8462
🛡️ Stop Loss: Below 0.67 or the previous low.
Volume is increasing, supporting the potential breakout — so entry can be considered now if volume keeps rising, or after a retest of the trendline for safer confirmation.
#API3USDT #Crypto #TradingView #TechnicalAnalysis #DoubleBottom #TrendlineBreakout
免责声明
这些信息和出版物并非旨在提供,也不构成TradingView提供或认可的任何形式的财务、投资、交易或其他类型的建议或推荐。请阅读使用条款了解更多信息。