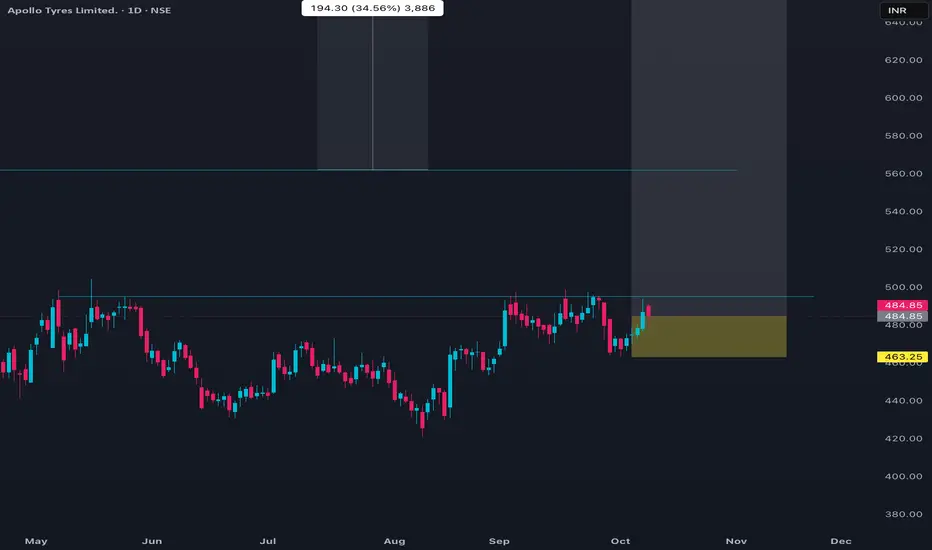
Apollo Tyres is currently trading in the range of 479 to 492. The last recorded price was about 487, following a recent day’s high of 491.5 and a low of 479.65. The volume on the last trading day exceeded 5.8 lakh shares, with an average delivery percentage around 50%. The stock is experiencing mild upward price momentum on short-term technicals, with several recent bullish EMA crossovers on daily charts.
Financially, the market capitalisation is about ₹30,800 crore. The trailing P/E ratio stands high over 36, while the P/B is just above 2. The EPS has seen a notable YoY decline. Over the last month, price movement has been flat to slightly positive, while medium-term (six months) shows a rise of more than 20%. Returns over the past year remain negative. The 52-week high is 557, and the low is 371.
Analyst consensus is positive with several recent buy ratings and a target clustered around the ₹590 level. The overall trend is positive in the short term, supported by technical indicators, while valuation remains elevated.
免责声明
这些信息和出版物并不意味着也不构成TradingView提供或认可的金融、投资、交易或其它类型的建议或背书。请在使用条款阅读更多信息。
免责声明
这些信息和出版物并不意味着也不构成TradingView提供或认可的金融、投资、交易或其它类型的建议或背书。请在使用条款阅读更多信息。