Disclaimer: This chart and analysis are not meant to be, and do not constitute, financial, investment, trading, or other types of advice or recommendations. Do your own due diligence before trading or investing in any stock exchanges, Indices, Stocks, Forex, Crypto etc.
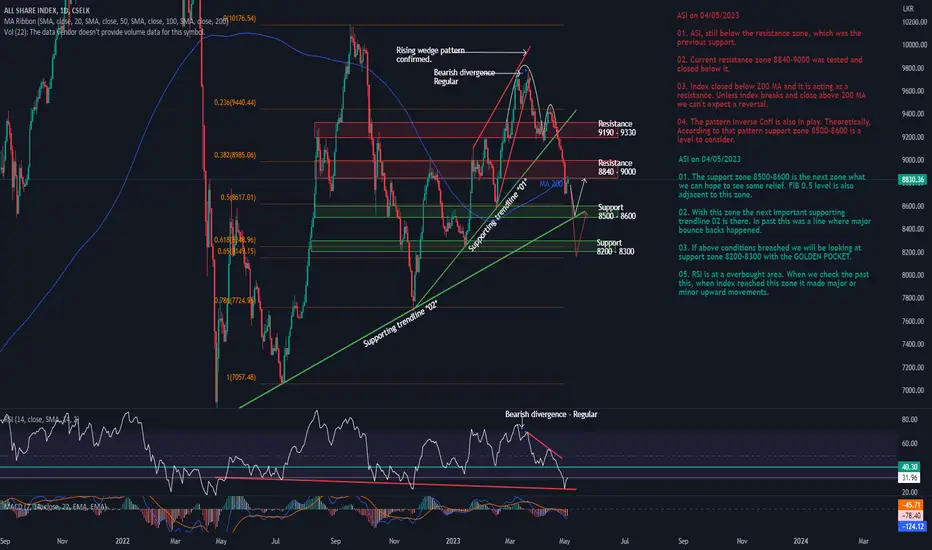
ASI on 04/05/2023
01. ASI, still below the resistance zone, which was the previous support.
02. Current resistance zone 8840-9000 was tested and closed below it.
03. Index closed below 200 MA and it is acting as a resistance. Unless index breaks and close above 200 MA we can't expect a reversal.
04. The pattern inverse CnH is also in play. Theoretically, According to that pattern support zone 8500-8600 is a level to consider.
ASI on 04/05/2023
01. The support zone 8500-8600 is the next zone what we can hope to see some relief. FIB 0.5 level is also adjacent to this zone.
02. With this zone the next important supporting trendline 02 is there. In past this was a line where major bounce backs happened.
03. If above conditions breached we will be looking at support zone 8200-8300 with the GOLDEN POCKET.
05. RSI is at a overbought area. When we check the past this, when index reached this zone it made major or minor upward movements.
免责声明
The information and publications are not meant to be, and do not constitute, financial, investment, trading, or other types of advice or recommendations supplied or endorsed by TradingView. Read more in the Terms of Use.
免责声明
The information and publications are not meant to be, and do not constitute, financial, investment, trading, or other types of advice or recommendations supplied or endorsed by TradingView. Read more in the Terms of Use.