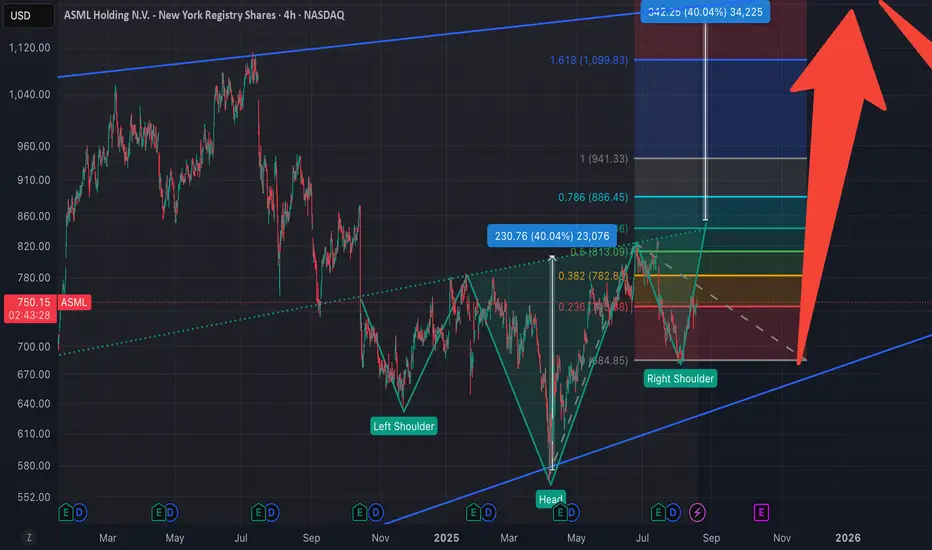
Based on the conjecture, the right shoulder is about to form. The head and shoulders bottom pattern will only complete upon a breakout above 840. If the price falls below the previous low (approximately 680), the conjecture fails. The projected rise from the head and shoulders bottom roughly aligns with the overhead resistance levels. The long-term chart pattern appears more like a wedge.
Short-term support: 68x
Short-term resistance: 84x
Target levels: 84x, 94x, 11xx
Short-term support: 68x
Short-term resistance: 84x
Target levels: 84x, 94x, 11xx
免责声明
这些信息和出版物并非旨在提供,也不构成TradingView提供或认可的任何形式的财务、投资、交易或其他类型的建议或推荐。请阅读使用条款了解更多信息。
免责声明
这些信息和出版物并非旨在提供,也不构成TradingView提供或认可的任何形式的财务、投资、交易或其他类型的建议或推荐。请阅读使用条款了解更多信息。